Figure 7.

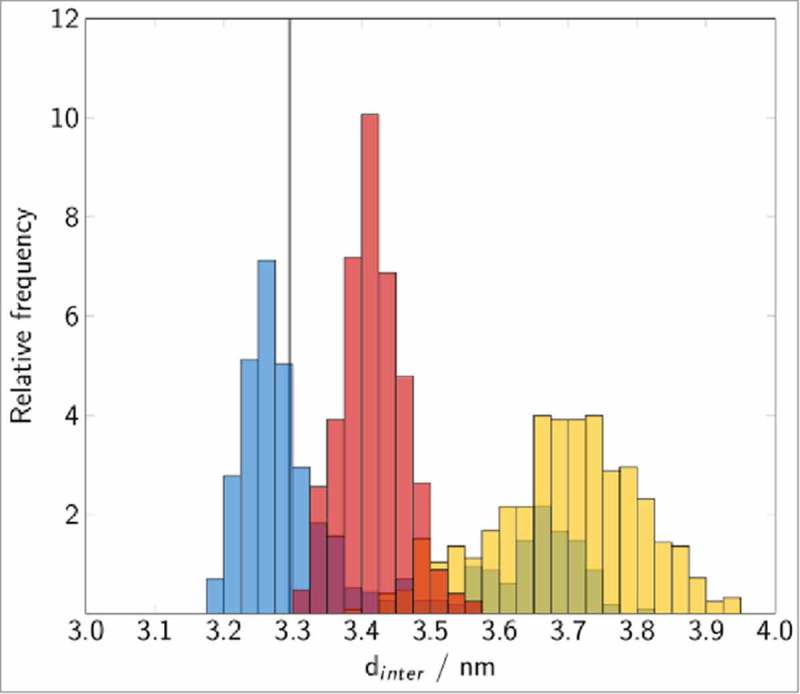
Distribution of the Rab5(GDP):GDI intermolecular distance in the cytoplasmic complex. The vertical line corresponds to the experimental value for Ypt1:yGDI.17 Histograms are coloured in blue (cytRun1), yellow (cytRun2) and red (cytRun3).

Distribution of the Rab5(GDP):GDI intermolecular distance in the cytoplasmic complex. The vertical line corresponds to the experimental value for Ypt1:yGDI.17 Histograms are coloured in blue (cytRun1), yellow (cytRun2) and red (cytRun3).