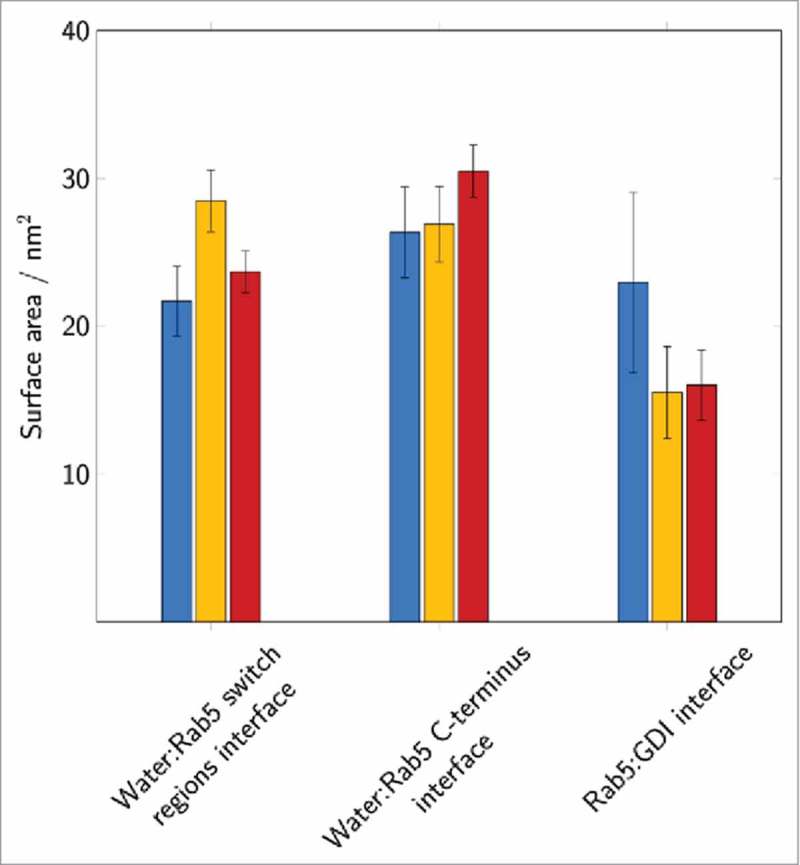
Figure 10.

The solvent accessible surface area of the Rab5 switch regions and the C-terminal region as well as the total Rab5(GDP):GDI interface were averaged over 200 ns of MD simulation. Data for the individual runs are coloured in blue (cytRun1), yellow (cytRun2) and red (cytRun3).
