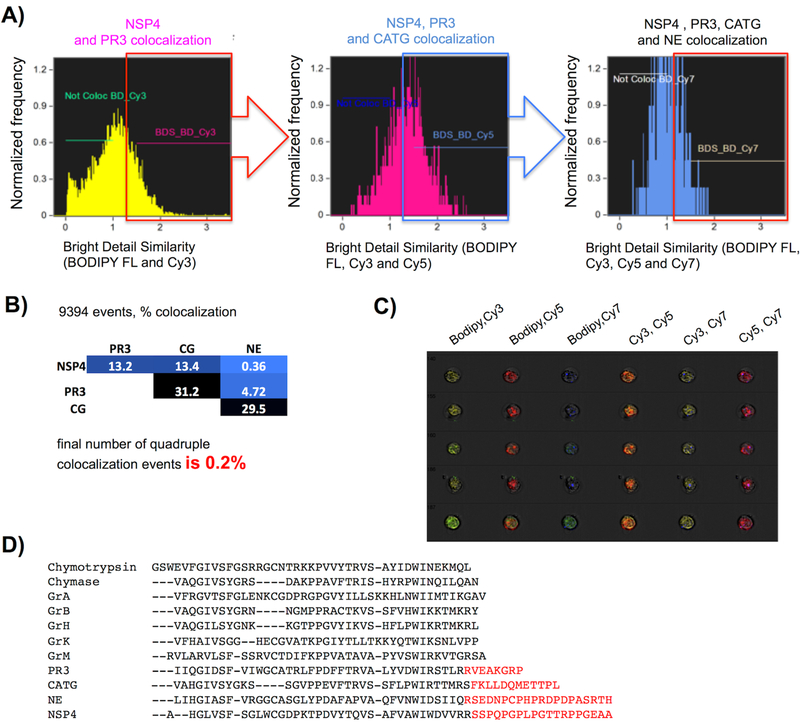
Figure 5. Quantitation of NSP probe colocalization and potential sorting signals encoded within NSPs.
Freshly isolated neutrophils from a healthy donor were treated with PK107, PK205, PK303 and PK402, followed by washing, fixation, and analysis by imaging flow cytometry with 60X objective and EDF. Single in-focus neutrophils were selected in IDEAS software with the Brightfield Gradient RMS, Brightfield Area, Brightfield Aspect Ratio, and Side Scatter Intensity features prior to NSP colocalization analysis. (a) Bright detail similarity (BDS) was calculated for each pair of probes according to fluorescence intensity from specifically labeled NSPs in neutrophils. Cells were considered colocalized for a probe pair if BDS ≥ 1.5. (b) Compilation of colocalized BDS events – final colocalization of all four BDSs is 0.2%. The analysis is a representative of experiments from 2 healthy donors. (c) An example of 5 of the 9,394 events used for quantitation. Each row represents images from one neutrophil. (d) Alignment of the C-terminal tails of HeSPs with the archetype of the family chymotrypsin. Red text indicates C-terminal extensions that are known (PR3, CATG, NE) or suspected (NSP4) to be cleaved during protease maturation.

