
Figure 1. SPRITE accurately maps known genome structures across various resolutions.
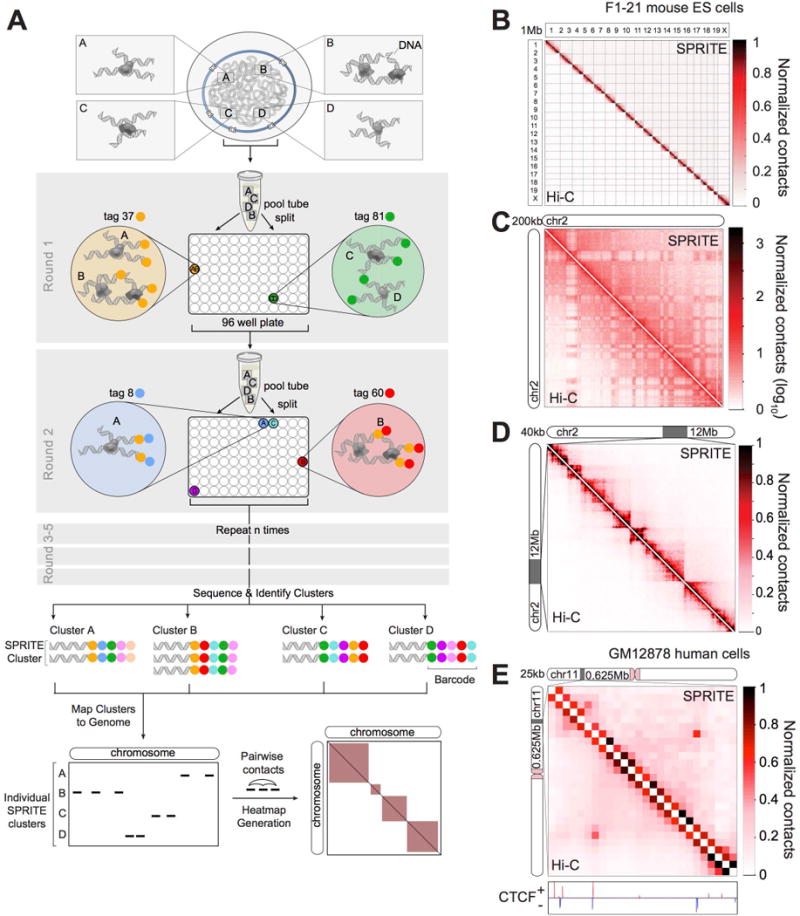
(A) Schematic of the SPRITE protocol. Crosslinked DNA is split into a 96-well plate and tagged with a unique sequence (colored circle) and then pooled into one tube. This split-and-pool process is repeated with tags sequentially added. DNA is sequenced, and tags are matched to generate SPRITE clusters. (B-D) Comparison of SPRITE (upper diagonal) and Hi-C (Dixon et al., 2012) (lower diagonal) in mouse embryonic stem cells (mESCs) (B) across all chromosomes at 1 Mb resolution, (C) on chromosome 2 at 200kb resolution (shown in log scale), and (D) within a 12 Mb region at 40 kb resolution. (E) Comparison of SPRITE and Hi-C (Rao et al., 2014) in human GM12878 cells within a 625 kb region at 25 kb resolution. CTCF binding (ENCODE) is colored based on motif orientation.