
Figure 3. SPRITE identifies interactions across large genomic distances and across chromosomes.
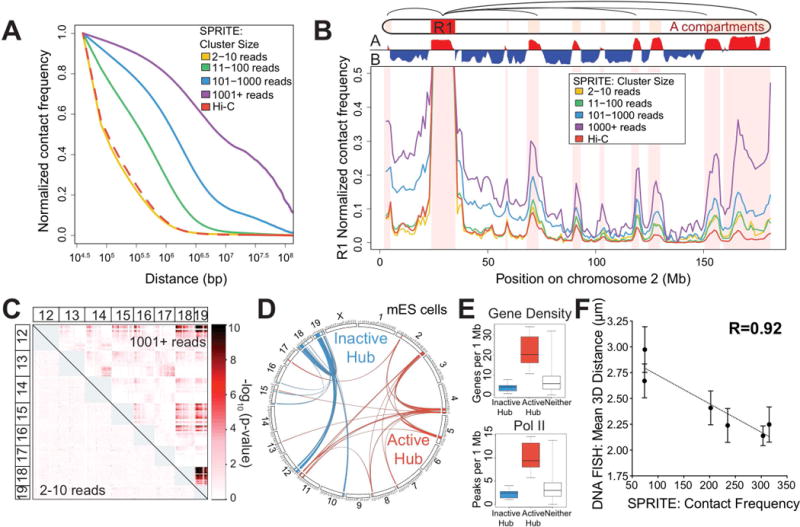
(A) Proximity ligation methods identify interactions that are close enough to directly ligate (green check), but miss those that are too far apart to ligate (red x). SPRITE identifies all crosslinked interactions within a complex and measures different DNA cluster sizes generated by fragmentation of the nucleus. (B) Relationship between contact frequency observed by Hi-C and different SPRITE cluster sizes relative to linear genomic distance in mESCs. (C) Contact frequency between a specific region (R1: 25-34 Mb) and other regions on mouse chromosome 2 for different SPRITE cluster sizes and Hi-C. Red shaded areas represent A compartment. (D) Interaction p-values are shown for SPRITE clusters of size 2-10 reads (lower diagonal) and 1001+ reads (upper diagonal) between mouse chromosomes 12 through 19. (E) Circos diagram of two sets of significant inter-chromosomal interactions are shown in blue (inactive hub) and red (active hub). (F) Box plots of gene density (left) and RNA polymerase II occupancy (right) for regions in the inactive hub (blue), active hub (red), or neither hub (grey).