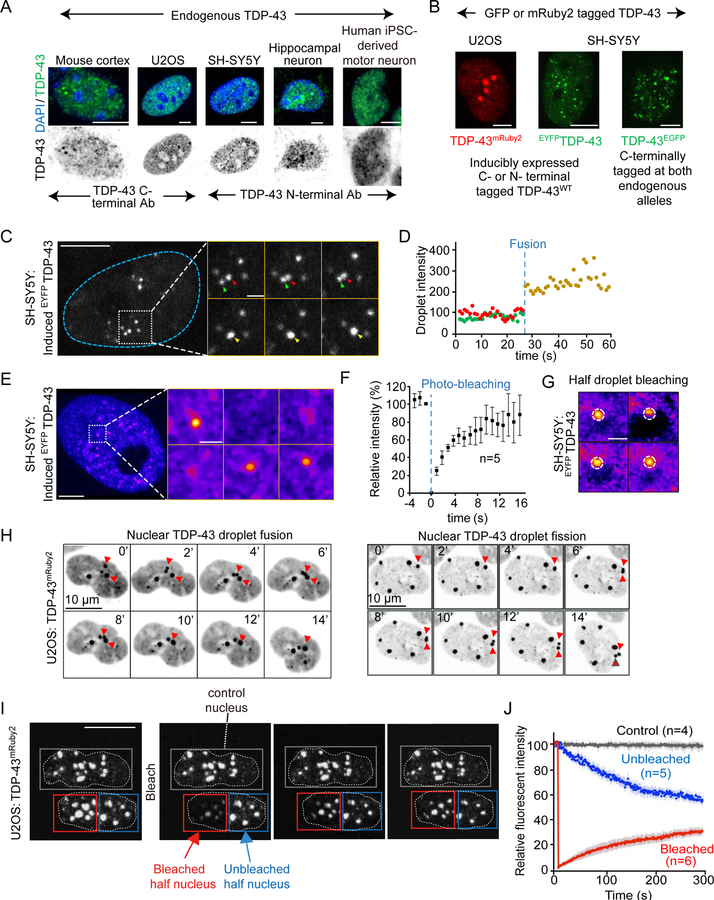
Figure 1. Nuclear TDP-43 de-mixes under physiological conditions.
(A) Endogenous TDP-43 detected by immunofluorescence (green) in multiple cell types (upper panels). Endogenous TDP-43 (green) and DAPI (blue); (lower panels) TDP-43 only (inverted in gray). (B) Representative images of nuclear particles of full-length TDP-43 in U2OS or SH-SY5Y cells stably expressing wild-type TDP-43 C-terminally tagged with mRuby2 (TDP-43mRuby2; left) or N-terminally tagged with EYFP (EYFPTDP-43; middle), respectively. C-terminally EGFP tagged TDP-43 expressed from both endogenous alleles in SH-SY5Y (right panel). (C) Representative fusion event of nuclear EYFPTDP-43 droplets in SH-SY5Y cells 24 hours post-induction of EYFPTDP-43 expression. Higher magnification is shown in the right panels. The green and red arrowheads point to two separated droplets before fusion, while the yellow one points to the fused droplet. (D) Fluorescence intensity of the indicated droplets in (C) before (red and green arrowheads) and after (yellow arrowhead) fusion, normalized to average droplet intensity before fusion. (E) FRAP of EYFPTDP-43 droplets in SH-SY5Y cells after 24 hours of expression. Higher magnification is shown in the right panel. The whole droplet was photobleached at 0’’. (F) Mean fluorescence intensity at the bleached area shown in (E) plotted over time, normalized to the average intensity of a droplet before photobleaching and represented as mean ± SEM [from the recovery curves of 5 droplets in a total of three independent experiments]. (G) FRAP of partial photobleaching of EYFPTDP-43 droplets in SH-SY5Y cells 24 hours after EYFPTDP-43 induction. (H) Fusion and fission events of TDP-43mRuby2 droplets in U2OS cells. Red arrowheads point to fusing or dividing droplets. (I) FRAP of nuclear TDP-43mRuby2 in U2OS cells. Half of one nucleus (outlined by the red box) was photobleached at 0’’. The blue box outlines the unbleached area of the other half of the nucleus; the gray box outlines an unbleached control nucleus in an adjacent cell. (J) Mean fluorescence intensity (normalized to the unbleached control nucleus) in the bleached and unbleached areas shown in plotted over time (represented as mean ± SEM from the recovery curves of 3 nuclei in a total of three independent experiments). See also Figure S1.

