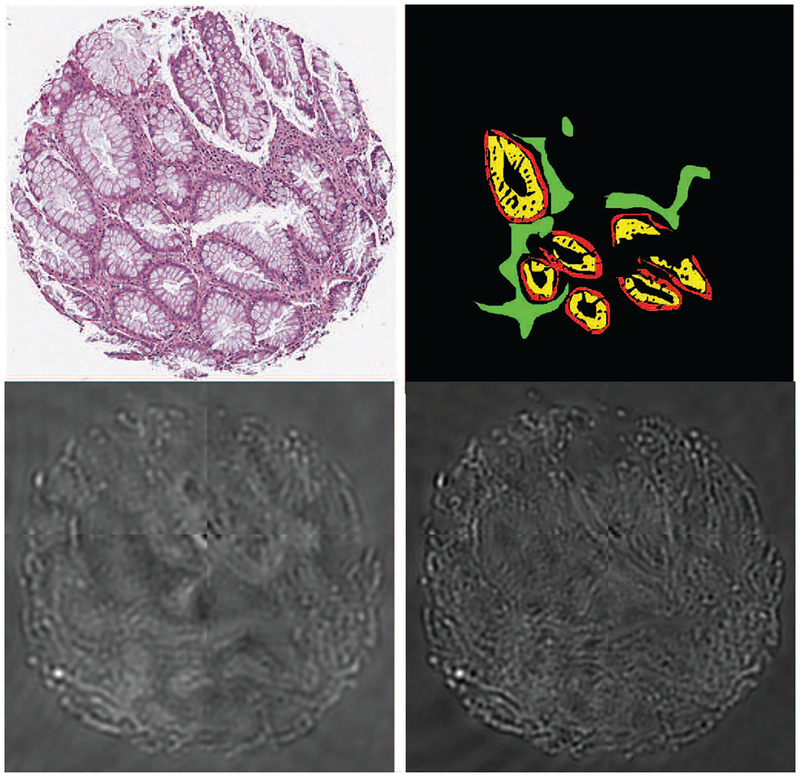
Fig. 1:
Top row: An H&E stained section of a colon tissue TMA core (left) with annotations on its serial HSI image (right) represented by red for epithelial absorptive cells, yellow for epithelial goblet cells, green for stroma, and black for un-annotated regions that include the previous three categories as well as non-tissue background. Bottom row: IR bands at 1,080 cm−1 (left) and 1,545 cm−1 (right) of its serial (adjacent) section. (Best viewed on a color monitor)

