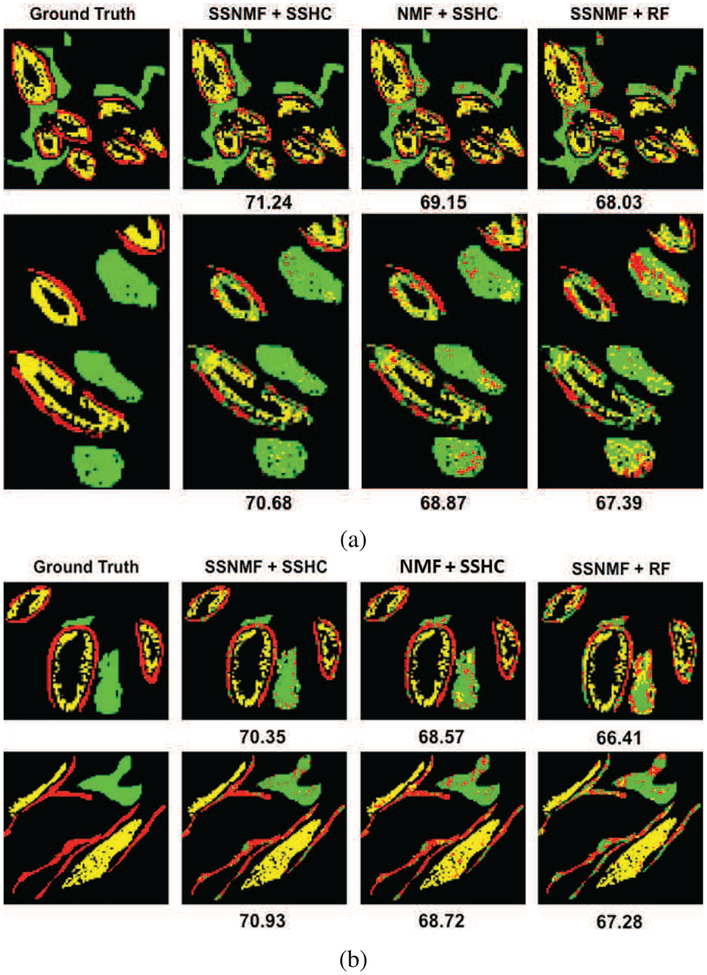
Fig. 10:
Examples of partially annotated ground truth (left), and corresponding pixel classifications by the best (SSNMF+SSHC, middle) and the second best (SSHC+RF, right) performing methods on two normal and two hyperplasia test images. Numbers under the images indicate F1-score (%) for the respective image. Red, yellow and green maps represent absorptive cells, goblet cells and stroma respectively. Black pixels were not annotated and their classification results are also not shown to facilitate comparison with the ground truth. (Best viewed on a color monitor). (a) Normal samples 1 (top) and 2 (bottom). (b) Hyperplaslia samples 1 (top) and 2 (bottom).

