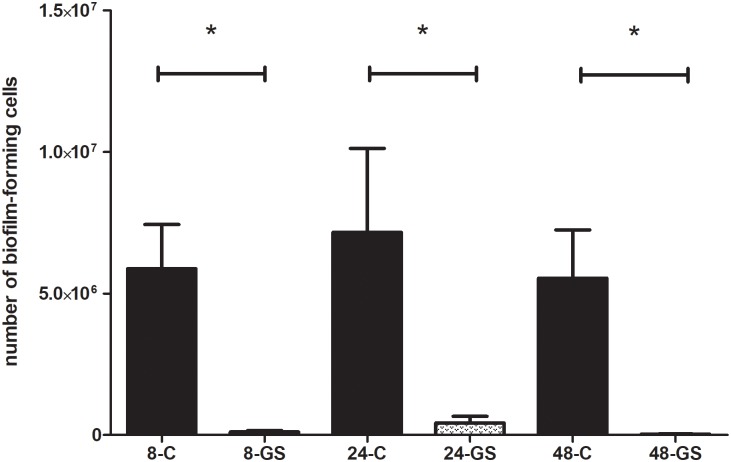
Fig 5. Comparison of the number of P.aeruginosa biofilm-forming cells after gentamicin sponge application [GS] to the number of biofilm-forming cells of untreated control samples [C].
8,24,48 –stand for the hours of incubation of the analyzed sample within the sponge. All the differences between the respective control and analyzed biofilm samples are statistically significant (M-W test, p<0.05).

