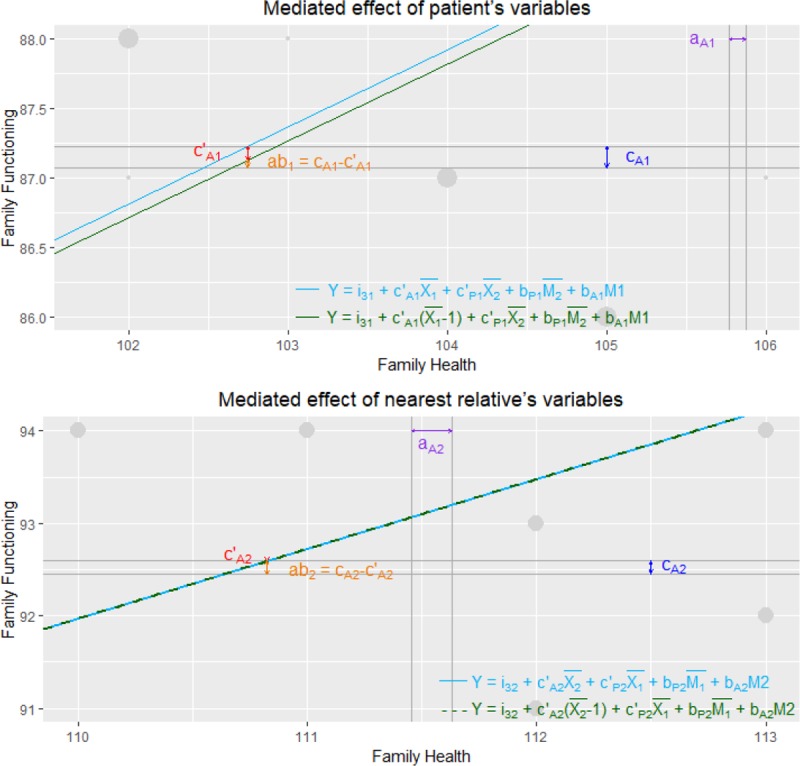
Fig 2. A graphical representation of the mediated effect for patients and nearest relatives.

For clarity reasons, only a small section of the overall graph is presented. Dots represent participants scores, with larger dots representing more observations. The distance between the vertical lines (i.e., aA1 and aA2) represents the predicted unit change in family health for a one unit change in social support for patients and nearest relatives, respectively. The distance between the horizontal lines (i.e., cA1 and cA2) depicts the predicted unit change in family functioning for a one unit change in social support. The distance between the two regression lines (i.e., c’A1 and c’A2) outlines the predicted unit change in family functioning for a one unit change in social support when holding the other mediating and predictor variables constant. The slope of the regression lines is the predicted unit change in family functioning for a one unit change in family health, adjusted for social support of both roles and family health of the other role. Finally, the indirect effect (i.e., ab1 and ab2) is the difference between the total effect (i.e., cA1 and cA2, respectively) and the direct effect (i.e., c’A1 and c’A2, respectively). Note. a (aA1/aA2), effect of perceived social support on family health; c (cA1/cA2), total effect of perceived social support on family functioning; ab, indirect effect of perceived social support on family functioning; c’, direct effect of perceived social support on family functioning. Blue and red slopes indicate effect of family health on family functioning.
