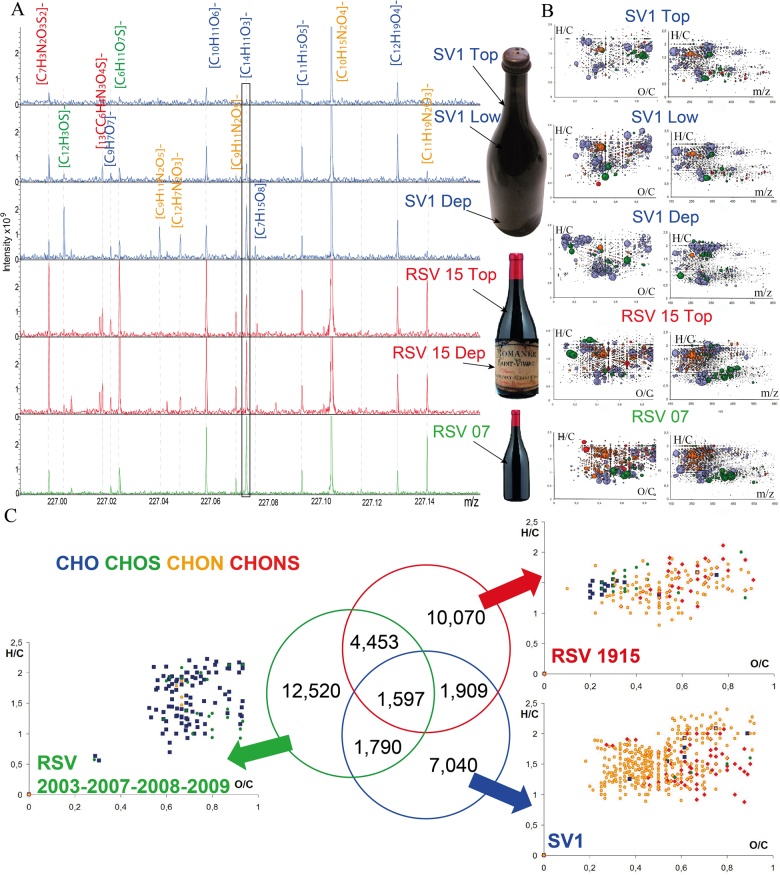
Fig. 2.
Negative-ion ESI FTICR mass spectra showing the overall similarity of Saint-Vivant wines. a Comparison of spectra in the m/z 226.90-227.20 Da mass range with the m/z 227.0713 identified by a blue box; b H/C vs. O/C van Krevelen diagrams and H/C vs. m/z diagrams of masses characteristic to SV1, RSV 1915, and RSV 2007 vintages. Bubble sizes indicate relative intensities of corresponding peaks in the spectra. c Venn diagram showing the counts of unique/common detected masses in the three following groups of wine: RSV 2003, 2007, 2008, 2009; RSV 1915 (Top and Dep); SV1 (Top, Low and Dep). Color code: CHO, blue; CHOS, green; CHON, red; CHONS, orange

