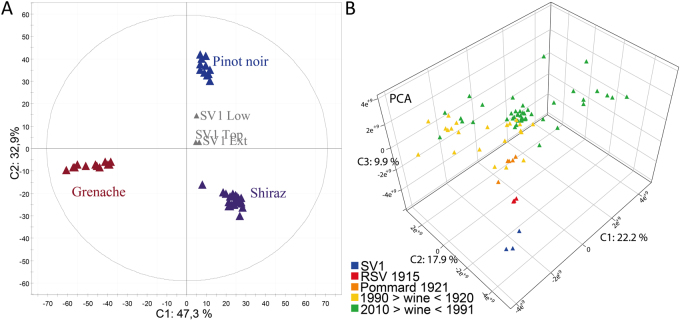
Fig. 3.
Multivariate statistical analyses of all mass features from FT-ICR-MS experiments. a PCA score plot of wines from the Tonnellerie 2000 experiment with three distinct grape varieties: Pinot noir (blue), Grenache (red) and Shiraz (purple), and showing SV1 wines (gray); PC1 and PC2 explained 47.3 and 32.9% of the variance. b PCA score plot of SV1 samples along with 77 Pinot noir red wines from Burgundy. PC1/PC2/PC3 explained 50.1% of the total variability (color code: wines younger than 1990, green; wine older than 1990, yellow; Pommard 1921 wines, orange; RSV 1915, red; SV1, blue)

