Figure 4.

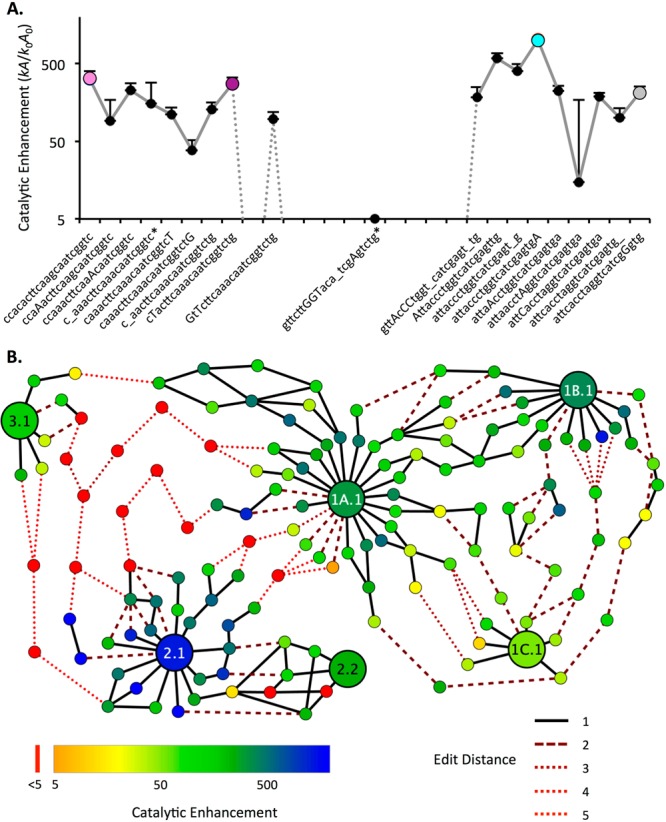
Evolutionary pathways for aminoacylation ribozymes. (A) Catalytic enhancement along a best pathway discovered from the center of Family 1B.1 (pink, S-1B.1-a), to 1A.1 (purple, S-1A.1-a), to 2.1 (cyan, S-2.1-a), to 2.2 (gray, S-2.2-a). Capital letters denote sequence positions changing at each step; underscore indicates a deletion. A large drop in activity is required for several mutations between Motif 1 and Motif 2. Error bars are standard deviation from triplicate measurements (only top bar is shown). Also see Supporting Figure S11. Asterisk (*) indicates a sequence that was found in only one replicate (RS1). (B) Evolutionary network displaying the 10 best pathways discovered between the centers of six key families (1A.1, 1B.1, 1C.1, 2.1, 2.2, and 3.1) representing each motif and submotif and the two most active centers from Motif 2. Each node is an individual sequence with activity measured by k-Seq indicated by color (see legend; red indicates activity at or below the baseline rate). The lines indicate mutational distance between sequences (solid black line = 1 mutation). Dotted lines indicate sequences at baseline activity (see legend). The majority (67%) of the edits along these pathways are substitutions; the remainder are indels.
