
Fig 5. Ferlavirus hemagglutinin-neuraminidase dimer models.
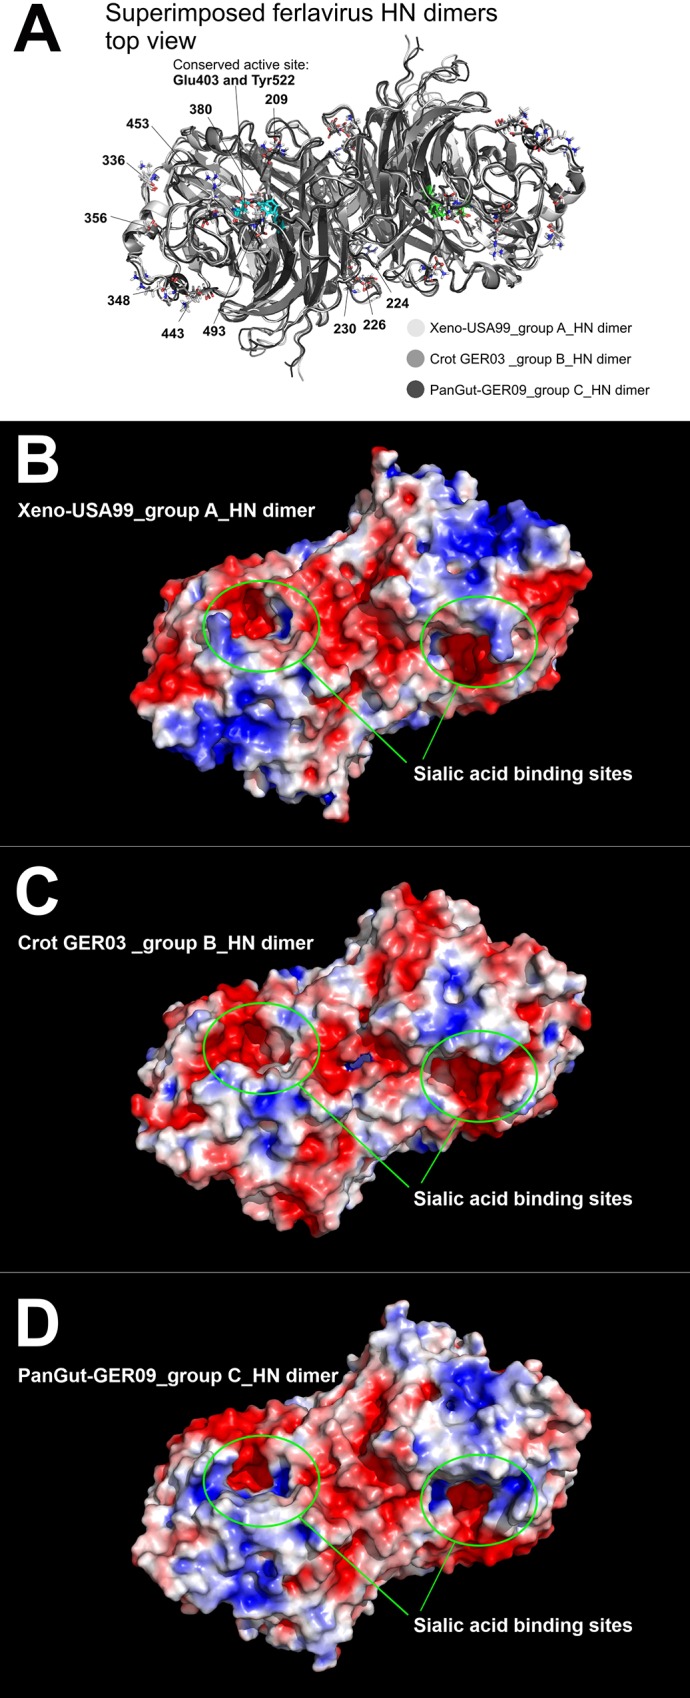
Superposition of the three ferlavirus HN proteins reveals tight structural similarity (A). Those residues that influence the electrostatic charge patterns are indicated on the figure. Electrostatic surface view of ferlavirus HN dimers (B, C, and D). Red represents regions with potential values less than -2.0 kT; white represents 0.0; blue shows regions greater than +2.0 kT.