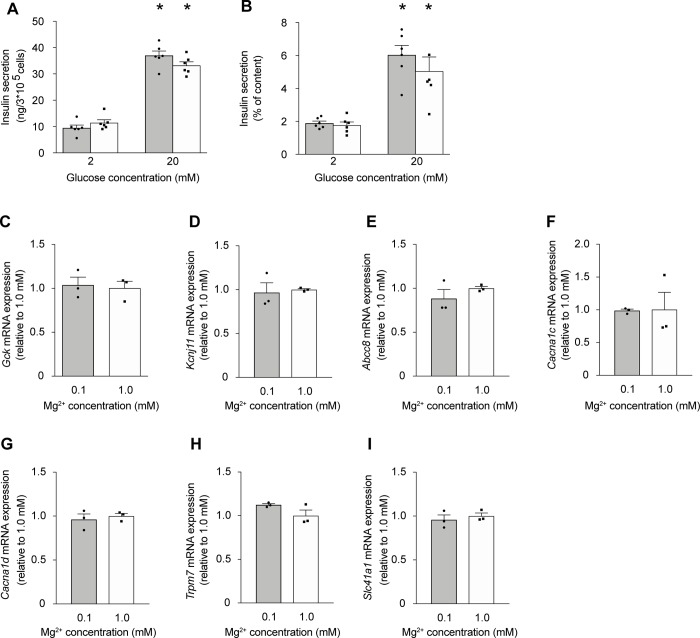
Fig 3. Extracellular Mg2+ does also not affect GSIS in INS-1 cells.
(A-B) INS1 cells were cultured for 48 hrs at 11 mM glucose (1.2 mM Mg2+) followed by 24 hrs at 5 mM glucose (1.2 mM Mg2+) prior to the experiment. Insulin secretion from INS-1 cells stimulated by 2 mM and 20 mM glucose with 0.5 mM Mg2+ (solid bar) and 1.0 mM Mg2+ (open bar) for 0.5 hr (representative experiment from three independent experiments). Insulin secretion is presented as ng/3*105 cells per hr (A) and normalized to total cell content (B). *, p < 0.05 (2mM vs. 20mM glucose) using two-way ANOVA. (C-I) The mRNA transcript levels of Gck (C), Kcnj11 (D), Abcc8 (E), Cacna1c (F), Cacna1d (G), Trpm7 (H), and Slc41a1 (I) were measured from INS-1 cells after 72 hrs of culture at standard glucose (11 mM) of which the last 48 hrs in low Mg2+ (0.1 mM) (solid bar) or physiological Mg2+ (1.0 mM) (open bar) culture conditions. mRNA expression levels were determined by quantitative RT-qPCR and normalized for Actb expression. Data are expressed relative to 1.0 mM Mg2+.

