Fig. 1.

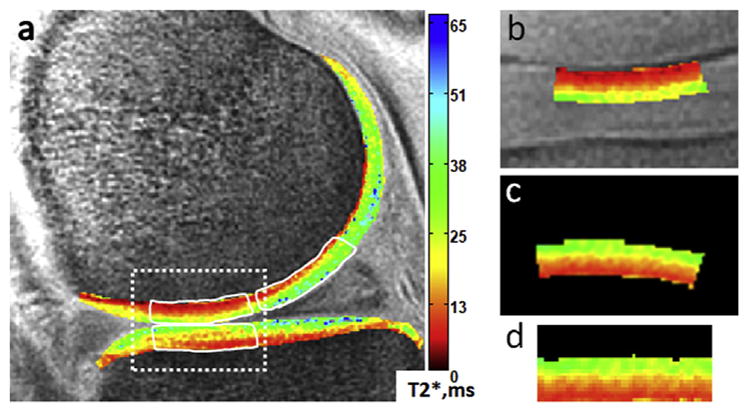
Sample mid-sagittal ultrashort echo time (UTE)-T2* map of an uninjured control subject (a). UTE-T2* profile characteristics were calculated in central medial femoral condyle (cMFC), central medial tibial plateau (cMTP) and posterior medial femoral condyle (pMFC). Briefly, regions of interest were defined such that: the cMFC (a – top left white outline) and cMTP (b – bottom white outline) included femoral or tibial cartilage, respectively, between the interior margins of the anterior and posterior horns of the medial meniscus; the pMFC (a – top right white outline) included femoral cartilage adjacent to the posterior horn of the medial meniscus. Prior to performing profile analysis, the extracted cMFC ROI (a – dashed box, and also b) was rigidly rotated (c) and vertically morphed to flatten (d).
