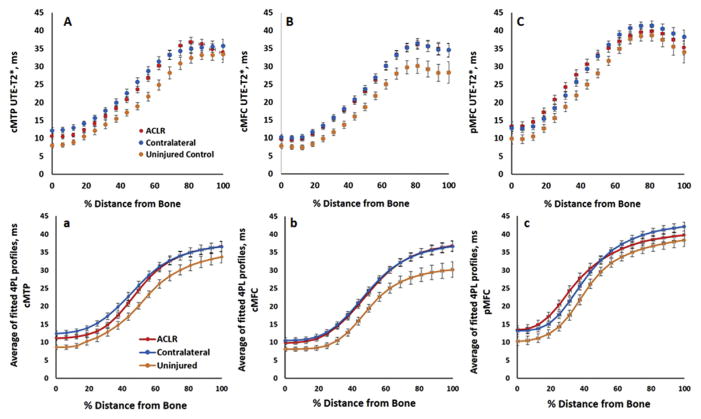
Fig. 4.
Mean measured ultrashort echo time (UTE)-T2* profiles (top row) and mean fitted four-parameter sigmoidal curves (bottom row) in the central medial tibial plateau (A,a), central medial femoral condylar (B,b), and posterior medial femoral condylar cartilage (C,c) averaged across 36 anterior cruciate ligament reconstruction (ACLR) subjects and 14 uninjured controls. Measured profiles and calculated sigmoidal curves of uninjured controls appear below those of both knees of anterior cruciate ligament (ACL)-reconstructed suggesting alterations to cartilage matrix organization in both knees of ACLR subjects compared to controls. Percent distance from bone is measured such that 0% indicates bone cartilage interface, 100% indicates synovial surface. Error bars represent ± SEM.

