Figure 3.
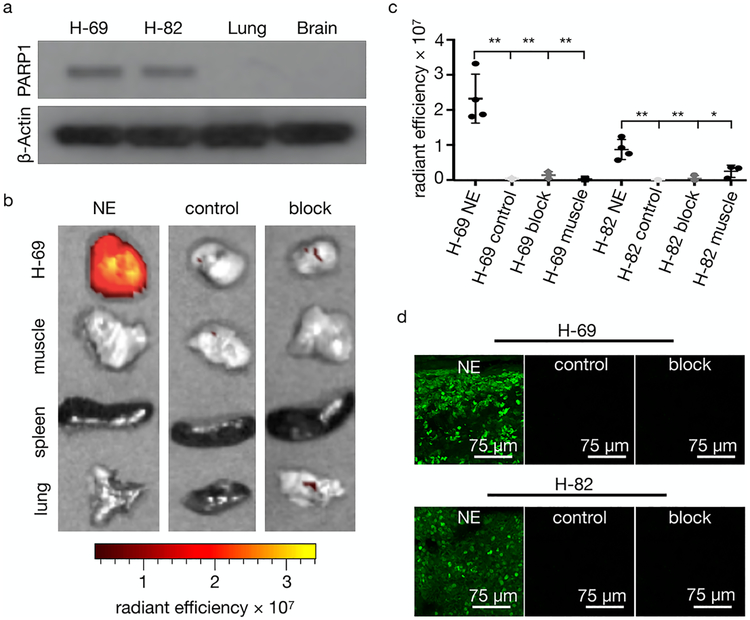
PARPi-FL NE biodistribution at 24 h postinjection in SCLC models in mice. (a) Western blot of PARP1 expression in H-69 and H-82 tissue lysates. (b) PARPi-FL NE epifluorescence imaging of excised H-69 tumors and tissues. Representative overlay images of H-69 tumor tissues were injected with PARPi-FL NE (0.39 mM, 78 nmol of PARPi-FL in 200 μL of PBS) compared to controls (not injected) or PARP1 blocking (23 mM, 4.6 μmol in 200 μL of PBS with 30% PEG300, 20% DMSO) 45 min before and 18 h after i.v. injection of PARPi-FL NE (0.39 mM, 78 nmol of PARPi-FL in 200 μL of PBS). (c) Epifluorescence intensity quantification of H-69 and H-82 xenografts from (b). P values were calculated with nonparametric Student’s t tests, unpaired; *P < 0.05, **P < 0.01. (d) Confocal images of PARPi-FL NE showing fluorescent signals from the imaging agent and no signals in control and block.

