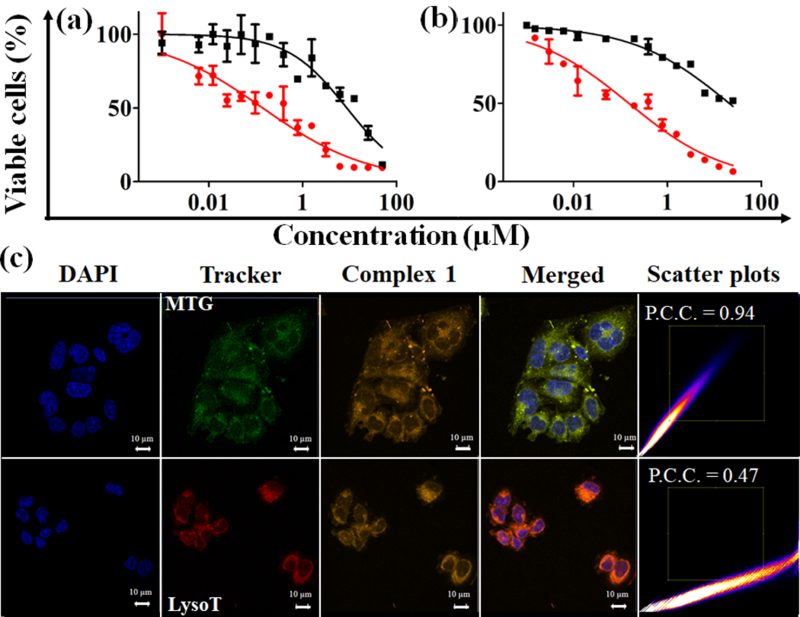
Figure 4.

Cell viability plots showing % viability as obtained in 1 treated (a) C-33 A and (b) MCF-7 cells for 4 h in dark and either photoexposed (near-IR light, 45 mins, red circles) or unexposed (dark, black squares) conditions. c) Confocal microscopic images in C-33 A cells showing DAPI(4’,6-diamidino-2-phenylindole, nuclear stain) in 1st column, trackers (Mito-Tracker® Green, 1st row; Lyso Tracker® Red DND-99, 2nd row) in 2nd column, complex 1 in 3rd column and merged of all three channels in 4th column. The near-IR emission of complex 1 is reproduced in orange colour. Scale bar = 10 μm. The scatter plots show degree of overlap between images in 2nd and 3rd column. Higher Pearson correlation coefficient (P.C.C.) indicates higher co-localization.
