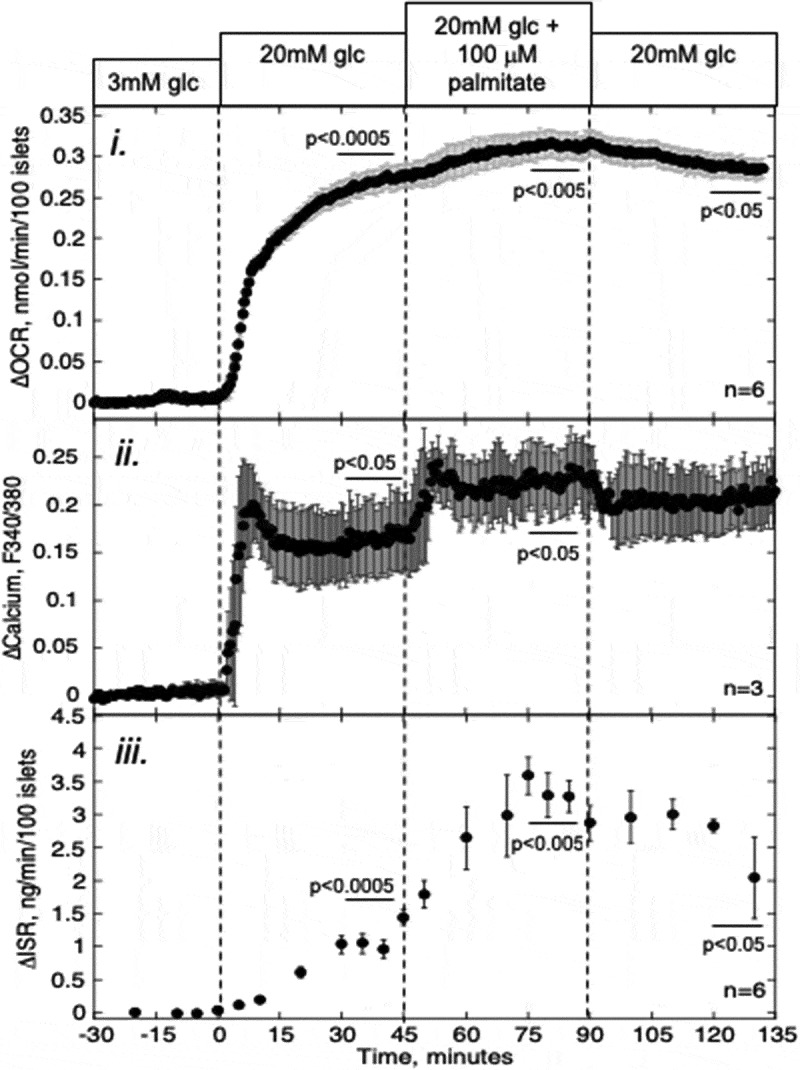
Figure 1.

Effect of PA on glucose-stimulated OCR, Ca2+, and ISR. Islets were perifused in the presence of 3 mM glucose for 90 min. Subsequently, at time = 0 on the graph, glucose was increased to 20 mM for 45 min, followed by exposure to PA for 45 min and a 45-min washout period as indicated. i and iii: OCR, and ISR were measured concomitantly using the flow culture system. ii: Detection of cytosolic Ca2+ by fluorescence imaging (measured in separate experiments). Data are displayed as the change in signal relative to the steady-state value obtained at 3 mM glucose (determined by averaging data obtained in the final 15 min prior to the increase in glucose). Steady-state values of OCR and ISR at 3 mM glucose were 0.35 ± 0.065 nmol/min/100 islets (n = 6) and 0.23 ± 0.052 ng/min/100 islets (n = 6), respectively. Statistical analysis was carried out by comparing steady-state values (determined by averaging data obtained in the final 15 min of each experimental condition) before and after each change in media composition using a paired t-test.
