. 2019 Jun 4;8:e43923. doi: 10.7554/eLife.43923

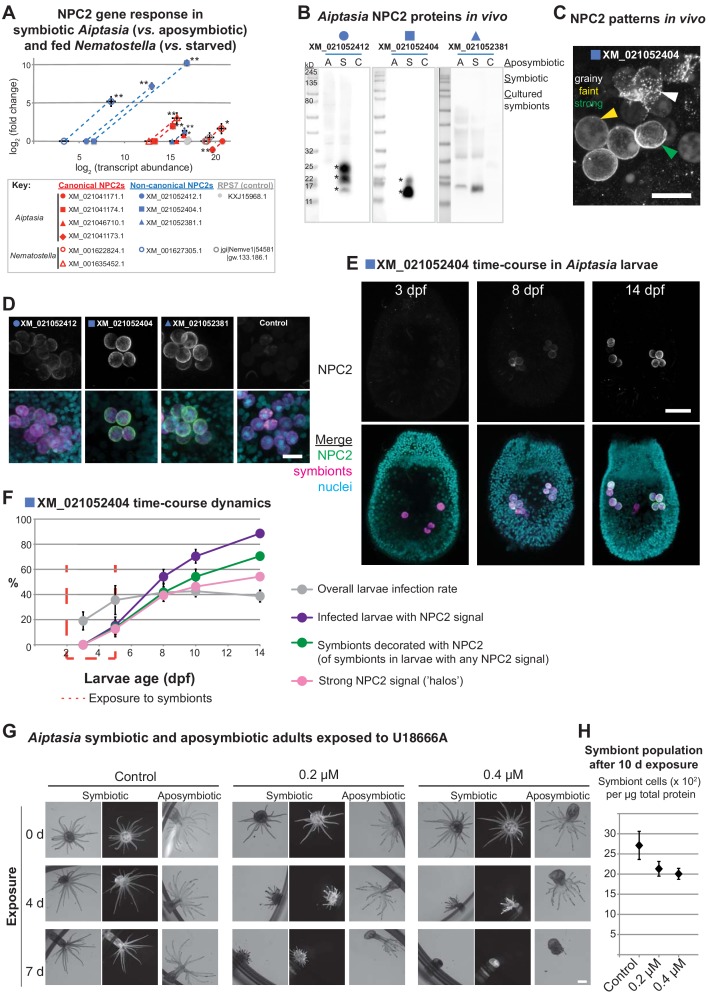
Figure 3. Non-canonical NPC2s respond to symbiosis and are spatiotemporally regulated to mature symbiosomes.

(A) Gene expression by RT-qPCR of canonical (red symbols) and non-canonical (blue symbols) NPC2s and 40S ribosomal subunit (RPS7, gray symbols). Filled symbols: Aiptasia. Open symbols: Nematostella. Average values ± SD (error bars). Statistical comparisons by Bayesian modeling (see Materials and methods), *p<0.05, **p<0.005. (B) Homogenates of aposymbiotic (A) or symbiotic (S) Aiptasia adults and cultured Symbiodiniaceae strain SSB01 (C) detected with affinity-purified antibodies to non-canonical Aiptasia NPC2 homologues. Asterisks, NPC2 glycoforms. (C) Immunofluorescence (IF) patterns of non-canonical NPC2 in 14 d post-fertilization (dpf) Aiptasia larvae containing intracellular symbionts of Symbiodiniaceae strain SSB01. Scale bar, 10 μm. (D) IF of several non-canonical Aiptasia NPC2s as in C. Merge channels: NPC2, secondary antibody Alexa488-anti-rabbit IgG; Nuclei, Hoechst; Symbionts, red autofluorescence of photosynthetic machinery. Control, secondary antibody only. Scale bar, 10 μm. (E) Time-course of immunofluorescence of non-canonical NPC2 in Aiptasia larvae infected with Symbiodiniaceae SSB01 from 2-5 dpf. Larvae oral opening facing up. Merge as in D. Scale bar, 25 μm. (F) Quantification of NPC2 IF time-course in E. Average value ± SEM (error bars). (G) Brightfield and fluorescence micrographs of symbiotic and aposymbiotic Aiptasia exposed to U18666A or DMSO negative control (vol. equiv. to 10 µM addition). Symbiont red autofluorescence as above. Scale bar, 1 mm. (H) Quantification of symbiont density in symbiotic anemones from G. Average values ± SEM (error bars).

Figure 3.

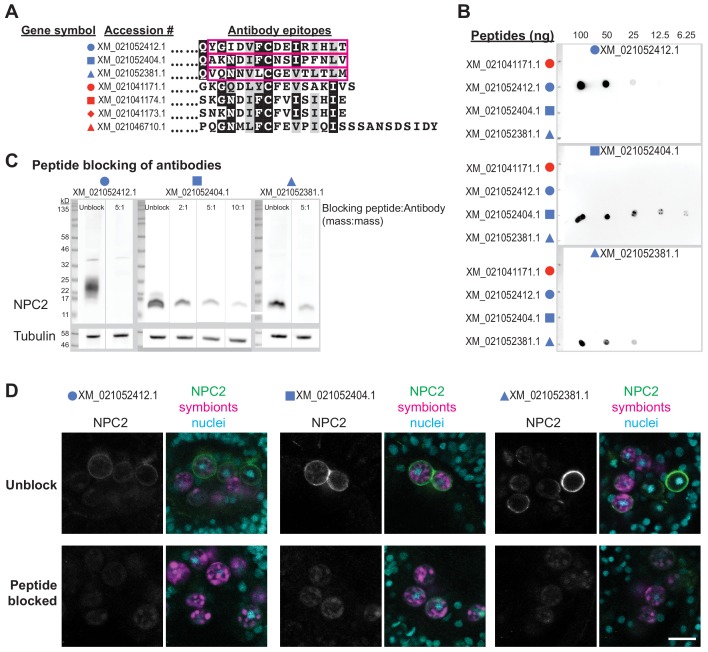
Figure 3—figure supplement 1. Validation of new antibodies raised against Aiptasia non-canonical NPC2s.

Figure 3—figure supplement 1.

(A) N-terminal-truncated aligned Aiptasia NPC2s, with gene symbols as in Figure 2A. Epitopes used for immunogenic peptides in antibody production. (B) Dot blots of the peptides in A at the given concentrations probed with the antibodies indicated at the top of each blot. (C) Western blots of symbiotic Aiptasia extract probed with the indicated antibodies as is (Unblock) or incubated together with the peptides in A at the given ratios. (D) Immunofluorescence of 14 dpf Aiptasia larvae infected with Symbiodiniaceae strain SSB01 from 2-5 dpf, either with the indicated antibodies as is (Unblock) or incubated together with the peptides in A (Peptide blocked). Peptide:antibody (mass:mass) ratios were 5:1 (XM_021052412, XM_021052381) or 50:1 (XM_021052404). Scale bar, 10 μm.

Figure 3—figure supplement 2. Differential maternal loading of canonical and non-canonical NPC2 transcripts in embryos of Acropora and Nematostella.

Figure 3—figure supplement 2.

(A) Expression in Nematostella vectensis adults and in embryos. From RNAseq regeneration/development dataset on NvERTx server (Warner et al., 2018; Fischer et al., 2014). (B) Expression in both Acropora digitifera parent colonies and their offspring immediately after spawning. Average value ± SD (error bars). Difference between non-canonical NPC2s in adults and embryos significant, Student’s paired t-test, p=0.007 (canonical, p=0.18).

Figure 3—figure supplement 3. Intracellular symbiont surrounded by non-canonical NPC2.

Figure 3—figure supplement 3.

NPC2 signal appears tightly localized around the symbiosome. Arrow, host cell cytoplasm within phalloidin-stained cell borders and near host cell nucleus (asterisk) showing absence of NPC2 signal. Scale bar, 10 μm.

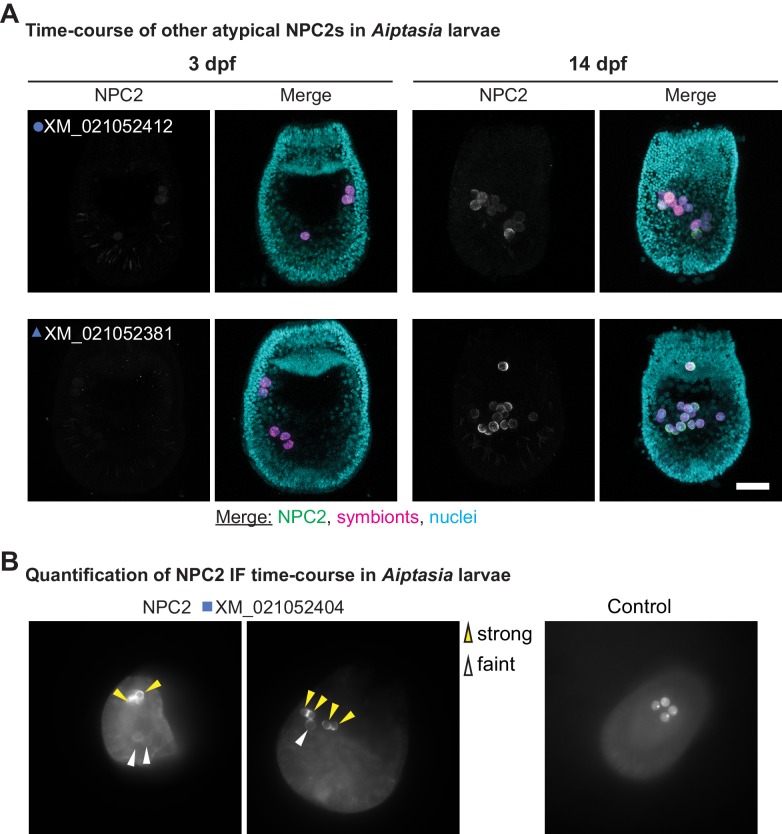
Figure 3—figure supplement 4. Dynamic recruitment of other non-canonical NPC2s to intracellular symbionts increases as symbiosis matures.

Figure 3—figure supplement 4.

(A) Immunofluorescence (IF) of non-canonical NPC2s in Aiptasia larvae containing intracellular symbionts of Symbiodiniaceae strain SSB01 at 3 and 14 dpf. Merge channels as in Figure 3. Control, secondary antibody only. Scale bar, 25 μm. (B) Example images for quantification of NPC2 IF time-course in Figure 3E + F and Figure 3—figure supplement 7, with strong and weak NPC2 staining indicated by arrows. Control, secondary antibody only.

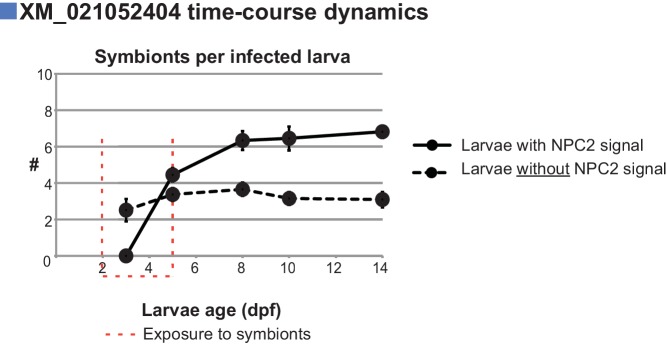
Figure 3—figure supplement 5. Quantification of symbiont load in Aiptasia larvae in a time-course of non-canonical NPC2 IF.

Figure 3—figure supplement 5.

Quantification of NPC2 IF time-course in Figure 3E + F. n = triplicate samples of >50 larvae per time-point. Representative of two independent experiments. Average value ± SEM (error bars).

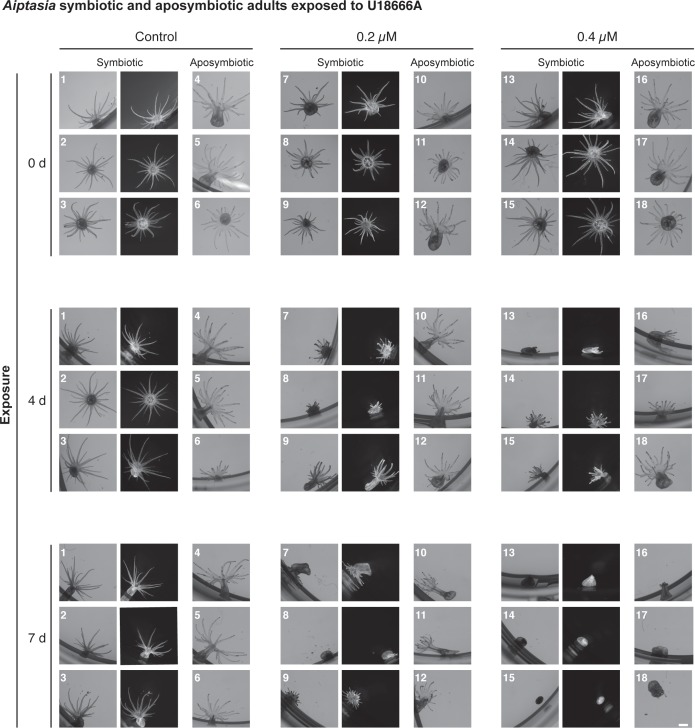
Figure 3—figure supplement 6. All symbiotic and aposymbiotic animals in the U18666A exposure experiment in Figure 3G + H.

Figure 3—figure supplement 6.

Scale bar, 1 mm.

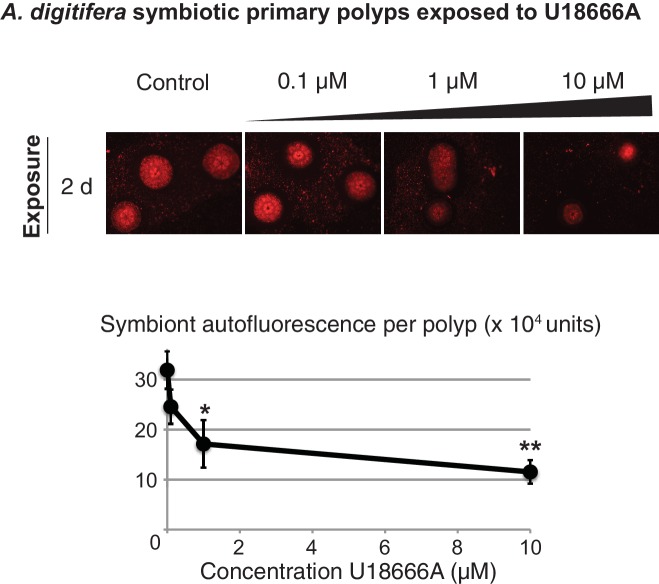
Figure 3—figure supplement 7. Acropora digitifera juvenile primary polyps hosting Symbiodiniaceae strain SSB01 exposed to U18666A or negative control.

Figure 3—figure supplement 7.

Average values ± SEM (error bars). Statistical comparisons to DMSO negative control (Student’s t-test: *p<0.05, **p<0.005).