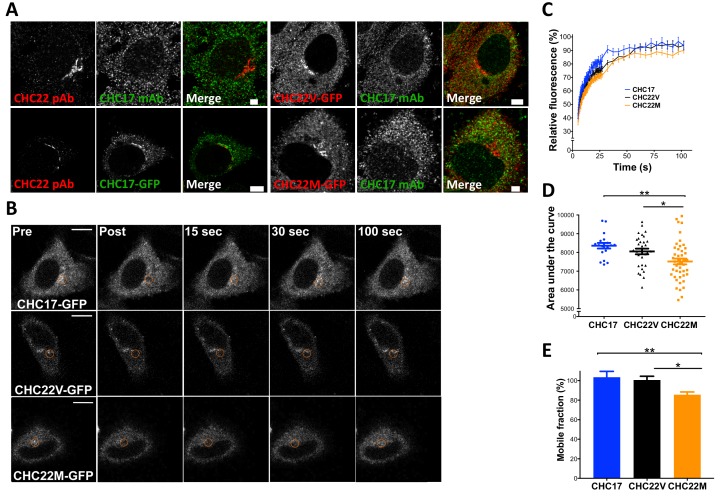
Figure 7. The CHC22-M1316 and CHC22-V1316 allotypes have different dynamics of membrane association, as measured by fluorescence recovery after photobleaching (FRAP).
HeLa cells were transfected with CHC22-M1316-GFP (CHC22M) or CHC22-V1316-GFP (CHC22V) or CHC17-GFP and the expressed constructs were localized relative to endogenous CHC22 and CHC17, which were also compared to each other (A). Endogenous CHC22, CHC17 and the transfected proteins were visualized by immunofluorescence with anti-CHC22 rabbit polyclonal antibody (pAb, red), anti-CHC17 mouse monoclonal antibody (mAb, green) and anti-GFP chicken polyclonal antibody (green for CHC17-GFP or red for CHC22-GFP), respectively. Bars represent 3 μm (untransfected and CHC22M-GFP) and 5 μm (CHC22V-GFP and CHC17-GFP). Transfectants were photobleached in the circular region indicated (B) and recovery of fluorescence (FRAP) was visualized over time (bars, 10 μm) and quantified within the bleached regions (C). For the data in (C), area under the curves (D) and mobile fractions Mf (E) were calculated (Lippincott-Schwartz et al., 2001). We performed a one-way analysis of variance (ANOVA) with Tukey’s multiple comparison post-hoc test: * p-value<0.05, ** p-value<0.01.

