. 2019 May 13;8:e42499. doi: 10.7554/eLife.42499

Figure 1. MAP-C identifies DNA sequences necessary and sufficient for inducible pairing between HAS1pr-TDA1pr alleles.

(A) In the cis MAP-C method, mutations in a ~ 250 bp segment of the genome are assessed for their effect on a specific 3D contact of that segment. Colored lines indicate mutant DNA sequences, and thin arrows indicate primers. (B) A ~ 150 bp region is sufficient for interchromosomal pairing. cis MAP-C was used to test 178 bp subsequences from the S. cerevisiae HAS1pr-TDA1pr region for pairing with the S. uvarum HAS1pr-TDA1pr. Shown are read coverage of the 3C (red) and genomic (gray) libraries, normalized to sum to 1. The two lines for each color represent technical replicates. Start positions and orientations of HAS1 and TDA1 coding sequences are shown on x-axis. (C) A minimal pairing region is sufficient for ectopic pairing. Shown are contact frequencies between HAS1pr-TDA1pr and a pairing (red) or non-pairing (gray) sequence (coordinates shown in Figure 1—figure supplement 1C) integrated at the FIT1 locus in haploid S. cerevisiae, as measured by 3C, normalized to contacts between FIT1 and HLR1 10 kb away. Bars indicate mean ± s.d. of technical triplicates. (D) Base-pairs necessary for pairing, shown as ratio of the total substitution frequency at each position in the 3C library compared to the genomic library. Error bars indicate the two technical replicates. Positions most strongly required for pairing (log23C/Genomic < −1.1) are highlighted in red. (E–I) Selected regions from panel D are highlighted, with sequence logos for matching transcription factor motifs. See Figure 1—figure supplements 2 and 3 for full set of overlapping motifs.

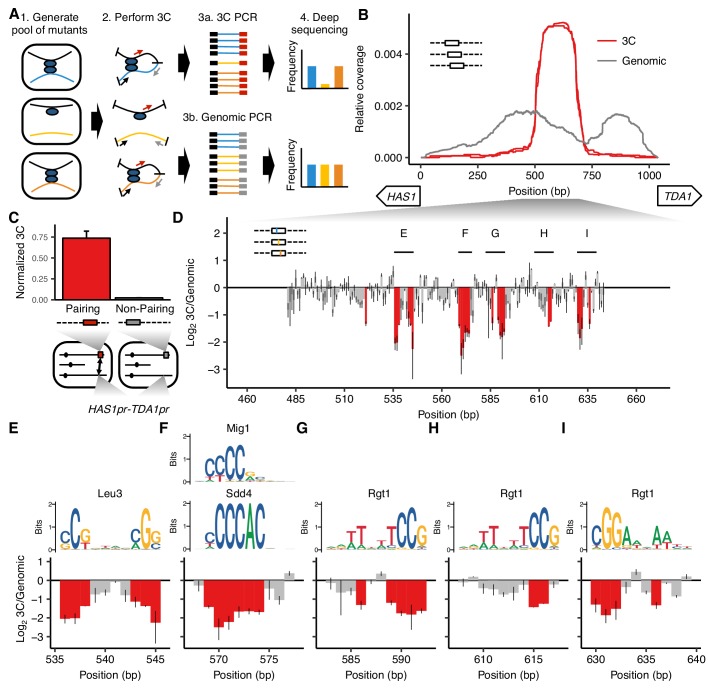
Figure 1.

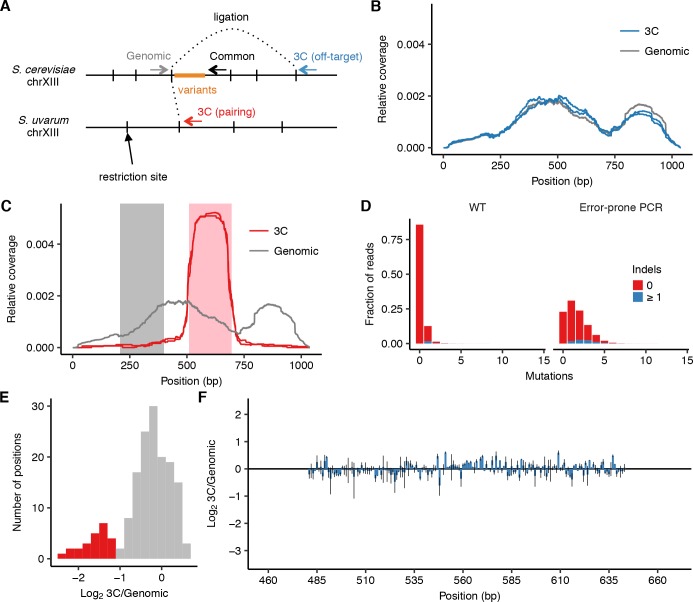
Figure 1—figure supplement 1. Design and controls for using cis MAP-C to dissect HAS1pr-TDA1pr pairing.

Figure 1—figure supplement 1.

(A) Schematic (not to scale) of primer locations for cis MAP-C experiments. (B) Off-target control results for 178 bp subsequences of S. cerevisiae HAS1pr-TDA1pr, shown as read coverage for 3C and genomic libraries. Each line represents a technical replicate. (C) Regions of HAS1pr-TDA1pr used for testing ectopic pairing. Pairing sequence shown in pink, and non-pairing control shown in gray. (D) Distribution of the number of mutations in the wild type and error-prone PCR genomic libraries. (E) Distribution of relative mutation frequency in 3C libraries. Positions most strongly required for pairing and highlighted in red in Figure 1D–I are also shown here in red; other positions are in gray. (F) Off-target control results for error-prone PCR mutagenesis of central S. cerevisiae HAS1pr-TDA1pr, shown as ratio of the total substitution frequency at each position in the 3C library compared to the genomic library. Error bars indicate the two technical replicates.
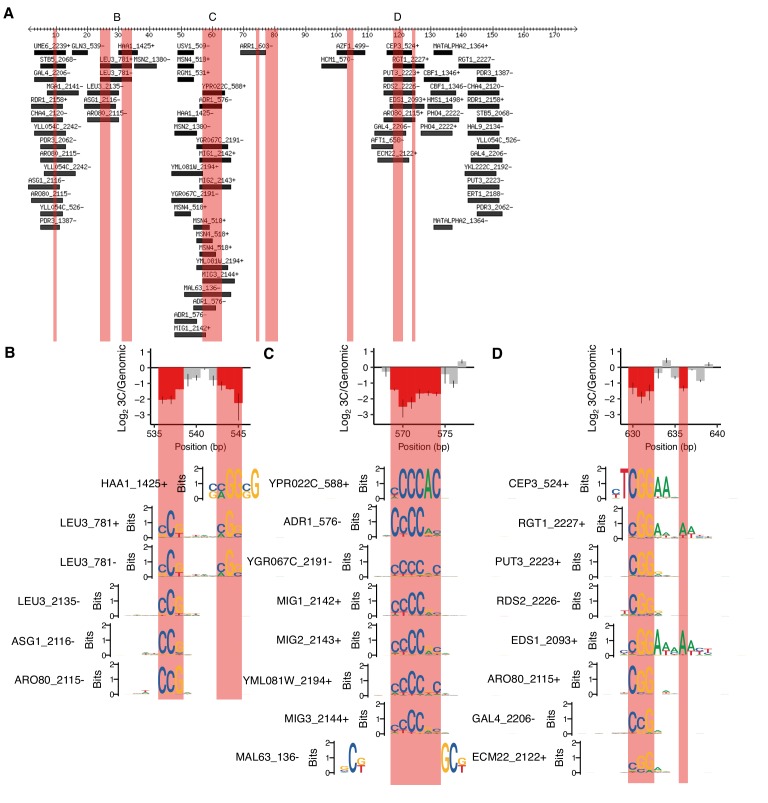
Figure 1—figure supplement 2. Motifs overlapping positions required for HAS1pr-TDA1pr pairing.

Figure 1—figure supplement 2.

(A) Motifs overlapping region of HAS1pr-TDA1pr containing positions required for pairing. Coordinates are relative to 511 bp upstream of the HAS1 coding sequence in S. cerevisiae (sacCer3). All ‘expert-curated no dubious’ motifs from YeTFaSCo (de Boer and Hughes, 2012) scoring at least 75% of the maximum possible score are shown. B, C, and D indicate regions highlighted in other panels. Pink regions indicate positions required for HAS1pr-TDA1pr pairing (same as in Figure 1D). (B–D) Sequence logos of motifs spanning the cluster(s) of positions required for pairing are shown aligned relative to the error-prone PCR cis MAP-C data from Figure 1E,F and I, in the same vertical order as in A.
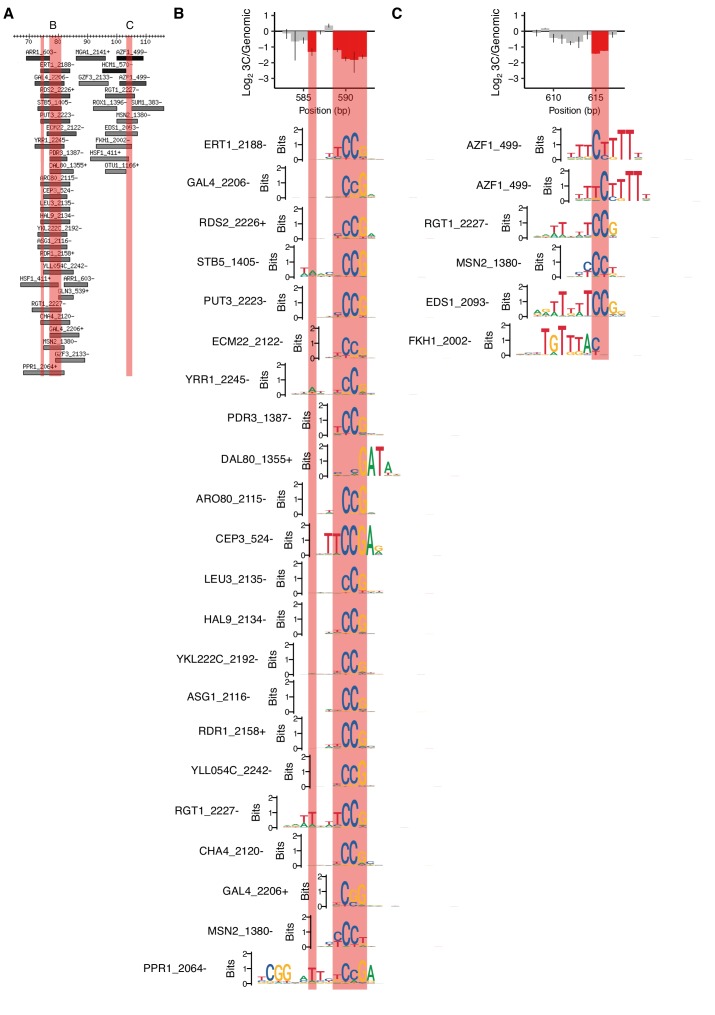
Figure 1—figure supplement 3. Lower-scoring motifs matching positions required for HAS1pr-TDA1pr pairing.

Figure 1—figure supplement 3.

(A) Motifs overlapping region of HAS1pr-TDA1pr containing positions required for pairing, zooming into the clusters of positions not shown in Figure 1—figure supplement 2. Coordinates are relative to 511 bp upstream of the HAS1 coding sequence in S. cerevisiae (sacCer3). All ‘expert-curated no dubious’ motifs from YeTFaSCo (de Boer and Hughes, 2012) scoring at least 45% of the maximum possible score are shown. B and C indicate regions highlighted in other panels. Pink regions indicate positions required for HAS1pr-TDA1pr pairing (same as in Figure 1D). (B–C) Sequence logos of motifs spanning the cluster of positions required for pairing are shown aligned relative to the error-prone PCR cis MAP-C data from Figure 1G and H, in the same vertical order as in panel A.
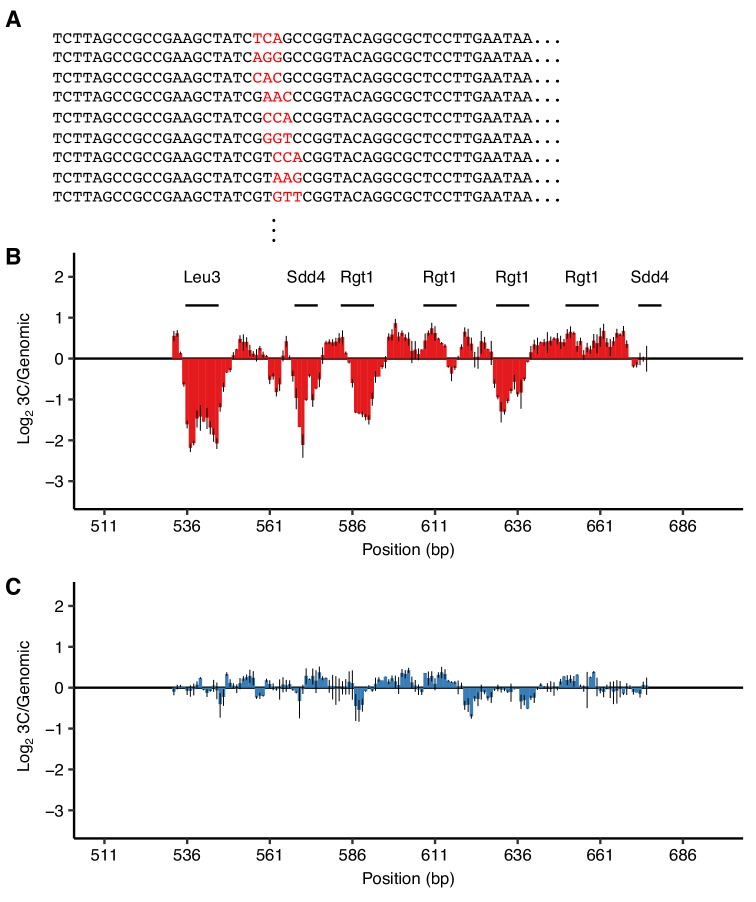
Figure 1—figure supplement 4. Validation of TF motifs required for HAS1pr-TDA1pr pairing with a 3 bp substitution mutant library.

Figure 1—figure supplement 4.

(A) Library design. Examples of mutant sequences, with mutations in red. Each set of 3 bp was replaced with three random 3 bp sequences so that every nucleotide was switched to every other nucleotide. (B–C) Ratio of the total substitution frequency at each position in the 3C library compared to the genomic library, for contacts between S. cerevisiae HAS1pr-TDA1pr and the S. uvarum homolog (B) or S. cerevisiae LCB1, an off-target control (C). Horizontal line segments indicate the positions of TF motif matches.
Figure 1—figure supplement 5. Conservation of TF motifs in HAS1pr-TDA1pr.

Figure 1—figure supplement 5.

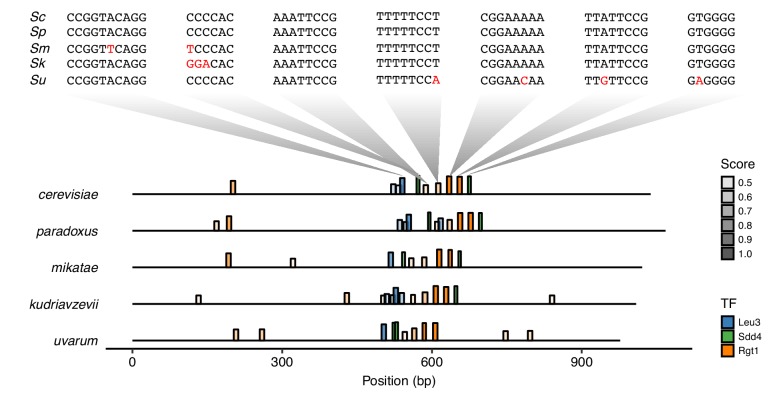
Position of Leu3, Sdd4, and Rgt1 motifs (at least 45% of maximum possible score, using high score position weight matrix from YeTFaSCo [de Boer and Hughes, 2012]) in the intergenic region between HAS1 and TDA1 in Saccharomyces sensu stricto yeasts S. cerevisiae, S. paradoxus, S. mikatae, S. kudriavzevii, and S. uvarum (order of divergence from S. cerevisiae). Bar height and transparency both represent motif score (as fraction of maximum possible score). Above, the sequences of the regions aligning to the S. cerevisiae motifs are shown in the same vertical order, with mismatches in red.