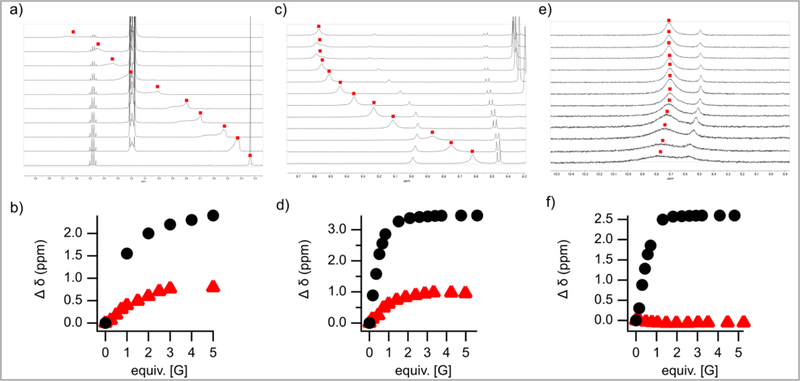
Figure 2:

NMR titrations of silanediol 1a (a), thiourea 11 (c), and squaramide 12 (e) with TBAOTf in CDCl3. b) Change in 2.33 ppm (-OH) when silanediol 1a was titrated with [G] = TBACl ( ) and TBAOTf (
 ). d) Change in 8.62 ppm (-NH) when thiourea 11 was titrated with [G] = TBACl (
 ) and TBAOTf (
 ). f) Change in 9.78 ppm (-NH) when squaramide 12 was titrated with [G] = TBACl (
 ) and TBAOTf (
 )
)
