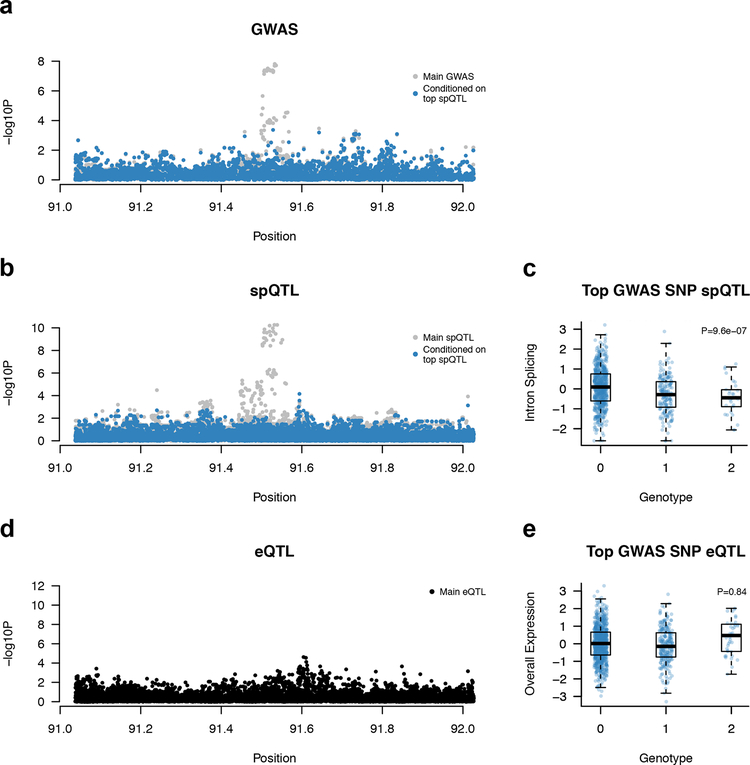
Figure 3. Splice-TWAS association at PRC1 implicates novel target gene independent of genetic effects on total expression.
Panels a, b, d show Manhattan plot of SNP-phenotype association before (gray) and after (blue) conditioning on the top splice-QTL (a: GWAS, N = 53,978; b,c: breast tumor junction, N = 654; d,e: breast tumor expression, N = 654). Panels c, e show box and scatter plots of normalized junction (top) and overall (bottom) expression, stratified by lead GWAS SNP genotype. Two sided p-value was computed from the GWAS summary data (a) or by linear regression (b-e). c,e: thick line is median, box is the interquartile range (IQR), whiskers are quartiles plus 1.5 IQR.

