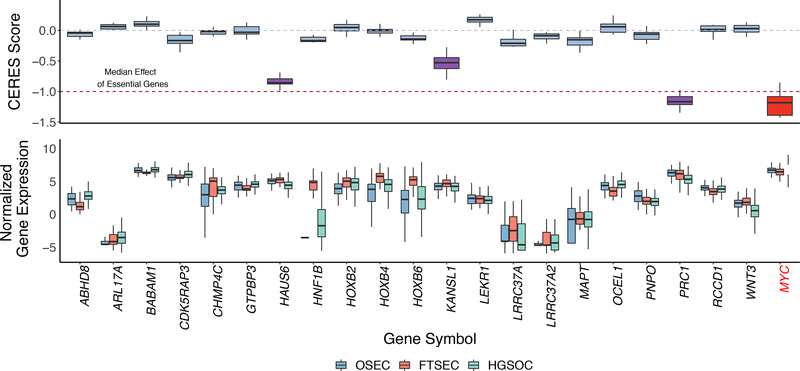
Figure 5. Functional analyses show evidence of essentiality for three TWAS/spTWAS genes.
a. Gene knockout experiments to determine gene essentiality for 13 HGSOC cell lines. CERES Score is a copy number corrected indicator of depletion of gene-targeting guide RNAs; the lower the CERES Score, the more essential the gene. MYC is a known essential gene and is included as a positive control. CERES Score thresholds corresponding to the median score for non-essential and essential genes are indicated with a blue dashed line at 0 and red dashed line at −1, respectively. Genes with a CERES Score ≤ −0.5 (and therefore showing evidence of essentiality) are highlighted with purple boxes. b. Relative expression of each gene in OSECs (N = 120), FTSECs (N = 71) and HGSOCs (N = 394). ARL17B and TIPARP-AS1 were not evaluated in the CERES screen and were therefore excluded from the plots. Boxes in each plot represent the first and third quartiles, and whiskers extend to 1.5 * IQR.

