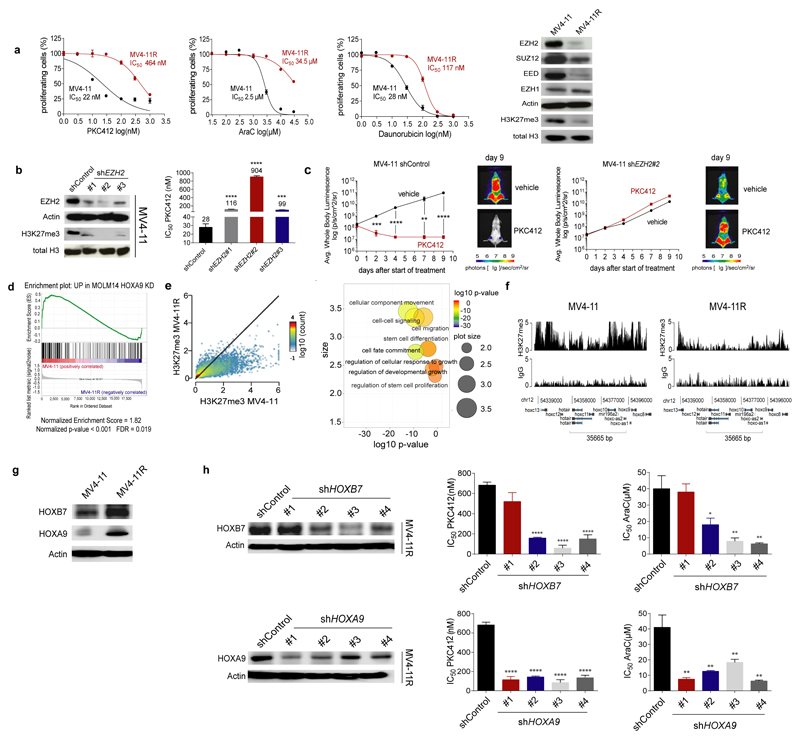
Figure 2. Loss of EZH2 induces dysregulation of HOX genes in resistant AML cells.
(a) Sensitive and drug-resistant MV4-11 (termed MV4-11R) cells were exposed to increasing concentrations of PKC412, AraC or daunorubicin for 72 hours. MTS assays were performed to determine the percentage of viable, proliferating cells. Means are given for three independent experiments ± s.d. IC50 values were calculated by nonlinear-regression analysis of inhibitor versus normalized response and are indicated (left). Immunoblotting of protein extracts from MV4-11 and MV4-11R was performed to detect PRC2 proteins and H3K27me3. Blots are representative for three independent experiments (right).
(b) Sensitive parental MV4-11 cells were lentivirally transduced with shRNAs targeting EZH2. Protein extracts of MV4-11 shControl and shEZH2 cells were analyzed for EZH2 and H3K27me3 protein expression. Data are representative for two independent experiments (left). MV4-11 shControl and shEZH2 cells were exposed to increasing concentrations of PKC412 for 72 hours. MTS assays were performed to determine the percentage of viable, proliferating cells and IC50 values were calculated as described. Means are indicated for three independent experiments ± s.d. (*** p= 0.0002, **** p< 0.0001) (right).
(c) 5×10⁶ MV4-11 shControl-luc or MV4-11 shEZH2 #2-luc cells were injected i.v. into NSG mice. Three days after tumour cell injection mice were treated with vehicle or PKC412 (75 mg/kg/d) by oral gavaging once daily for 9 consecutive days starting at day 3 post-transplantation. Leukemic bone marrow infiltration was monitored by noninvasive luciferase imaging. Means ± s.d. are given for each group (** p=0.0022, *** p=0.001, **** p< 0.001) (n=6 for PKC412 treatment groups, n=4 for vehicle groups).
(d) Gene Set Enrichment Analysis (GSEA) showed significant enrichment of upregulated genes in sensitive MV4-11 with genes upregulated in Molm14 HOXA9 knockdown cells60 (Normalized Enrichment Score (NES) of 1.82 (p <0.001, false discovery rate [FDR] = 0.019).
(e) ChIP-Seq revealed significant loss of H3K27me3 at multiple loci in MV4-11R cells. Depicted are H3K27me3 positive loci in sensitive and resistant cells (n=11472, r=0.584) (left). Gene Ontology (GO)- pathways analysis was performed for all genes with reduced H3K27me3 in MV4-11R cells. GO- IDs were visualized using RVIGO (Reduce and Visualize Gene Ontology). Representative, significantly overrepresented biological process pathways are shown (right).
(f) ChIP-Seq of H3K27me3 levels at HOX gene loci in MV4-11 and MV4-11R cells are shown. ChIP DNA from three independent experiments was pooled and sequenced.
(g) HOXB7 and HOXA9 protein expression was determined in MV4-11 and MV4-11R cells by western blotting. Blots are representative for two independent experiments.
(h) MV4-11R cells were lentivirally transduced with different shRNAs targeting HOXB7 or HOXA9, respectively, and protein extracts were analyzed for HOXB7 and HOXA9 expression. Data are representative for two independent replicates (left). Control cells, HOXB7- and HOXA9- knockdown cells were exposed to increasing concentrations of PKC412 and AraC respectively, for 72 hours. MTS assays were performed to determine the percentage of viable, proliferating cells. Means of IC50 values ± s.d. are shown for three independent experiments (* p= 0.0131, ** p < 0.009, **** p< 0.0001) (right).

