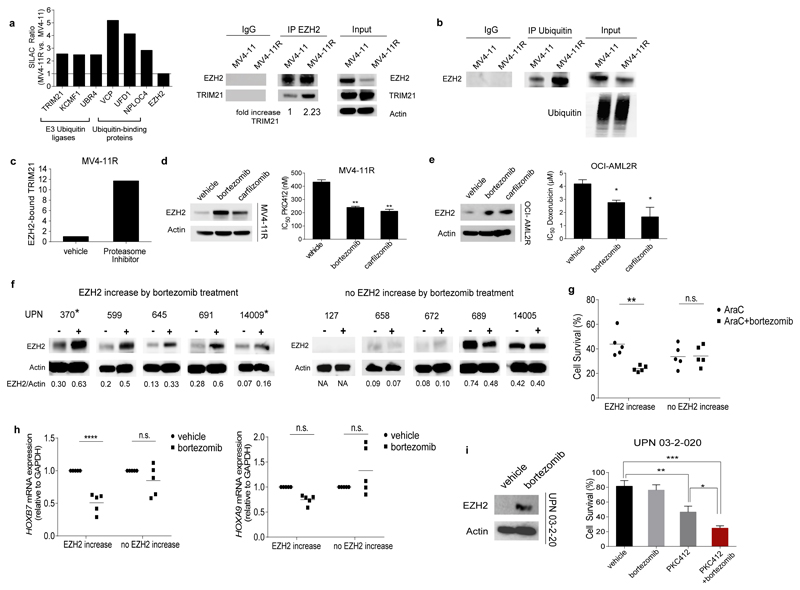
Figure 4. EZH2 is degraded by the proteasome in resistant cells and proteasome inhibitors restore EZH2 protein levels and drug sensitivity.
(a) Ubiquitin degradation pathway-associated proteins bind preferentially to EZH2 in resistant cells. Enrichment is represented by the SILAC Ratio ((H/L normalized MV4-11R) / (H/L normalized MV4-11)). H= heavy isotope, L= light isotope. Protein names are indicated at bottom of bars (left). Protein extracts from MV4-11 and MV4-11R cells were immunoprecipitated using anti-EZH2 antibody. A 5-fold excess of resistant IP-lysate was used to normalize IPs for reduced EZH2 levels in resistant cells. Precipitated proteins were immunoblotted and analyzed with anti-TRIM21 and anti-EZH2 antibody. Results are representative for two independent experiments. IP using an IgG antibody is provided as negative control (right).
(b) Immunoprecipitation using anti-Ubiquitin antibody and subsequent immunoblot for EZH2 in MV4-11 and MV4-11R cells. A 5-fold excess of resistant IP-lysate was used to normalize IPs for reduced EZH2 levels in resistant cells. Results are representative for two independent experiments
(c) Enrichment of EZH2-bound TRIM21 in MV4-11R and MV4-11R treated with Proteasome Inhibitors was calculated from the SILAC Ratio ((H/L normalized MV4-11R+Proteasome Inhibitor) / (H/L normalized MV4-11R)) and standardized to EZH2 levels.
(d) MV4-11R cells were exposed to 10 nM bortezomib or carfilzomib for 24 hours. Protein lysates were analyzed for expression of EZH2 by western blot. Data represent two independent experiments (left). MV4-11R cells were pretreated with 10 nM bortezomib or carfilzomib, respectively, for 6 hours and proliferation of cells was analyzed in the presence of increasing concentrations of PKC412 after 48 hours by MTS assay. Means of IC50 values ± s.d. are shown for three independent experiments (** p< 0.01) (right).
(e) OCI-AML2R cells were incubated with 10nM bortezomib or carfilzomib for 24 hours. Protein lysates were analyzed for the expression of EZH2. Data are representative for two independent experiments (left). OCI-AML2R cells were pretreated for 6 hours with 10nM bortezomib or carfilzomib and proliferation of cells was analyzed in the presence of increasing concentrations of doxorubicin after 72 hours by MTS assay. Means of IC50 values ± s.d. are shown for three independent experiments (* < 0.05) (right).
(f) Samples from AML patients with normal karyotype and low to intermediate EZH2 levels were cultured in vitro and exposed to 10nM bortezomib for 6 hours. EZH2/Actin ratios are indicated. Samples from relapsed patients are marked by asterisks. (-) indicates exposure to vehicle, (+) indicates exposure to bortezomib. Clinical characteristics for all patients are listed in Suppl. Table 15. Patients 370, 599 and 689 possess FLT3-ITD mutation.
(g) Treatment response of AML patients blasts with and without EZH2 increase after bortezomib exposure. Blasts were pretreated for 6 hours with 10nM of bortezomib and subsequently exposed to AraC for 48 hours. Data are analyzed by two-way ANOVA with Sidaks post-hoc test (** p< 0.005).
(h) HOXB7 (left) and HOXA9 (right) mRNA expression of AML patients with and without EZH2 increase after bortezomib exposure. The expression of vehicle-treated samples was set at 1 as reference. Data are analyzed by two-way ANOVA with Sidaks post-hoc test (**** p<0.0001).
(i) Primary AML cells from a relapsed AML patient with FLT3-ITD mutation (UPN 03-2-020) were exposed to vehicle or 10 nM bortezomib for 6 hours. EZH2 protein levels were analyzed by western blot (left). Vehicle- or bortezomib-pretreated AML blasts were exposed to 10nM of PKC412. Cell survival was determined by Acridin Orange/PI staining and cell counting from three technical replicates (* p= 0.0122, ** p= 0.0056, *** p= 0.0003) (right).

