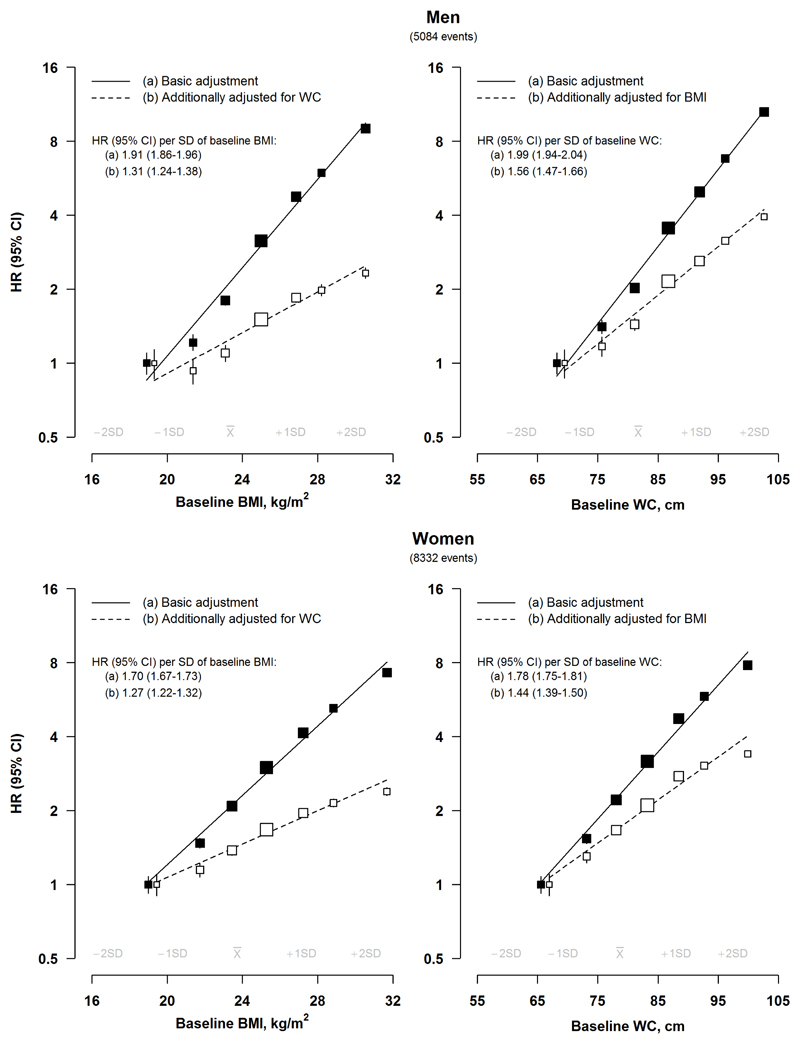
Figure 1. Adjusted hazard ratios (95% CI) for diabetes by BMI and waist circumference.
Basic adjustment results are stratified by age and study area and adjusted for education, household income, occupation, smoking, alcohol consumption, physical activity and family history of diabetes. Squares represent the HR with area inversely proportional to the variance of the log HR and error bars indicate the 95% CI. Adjusted HRs are plotted against mean BMI and waist circumference (WC) levels in each category. To avoid overlap of 95% CI lines, the boxes and their 95% CIs for the reference groups were moved apart slightly from the actual positions. Continuous associations reflect sex-specific BMI and waist circumference SDs.

