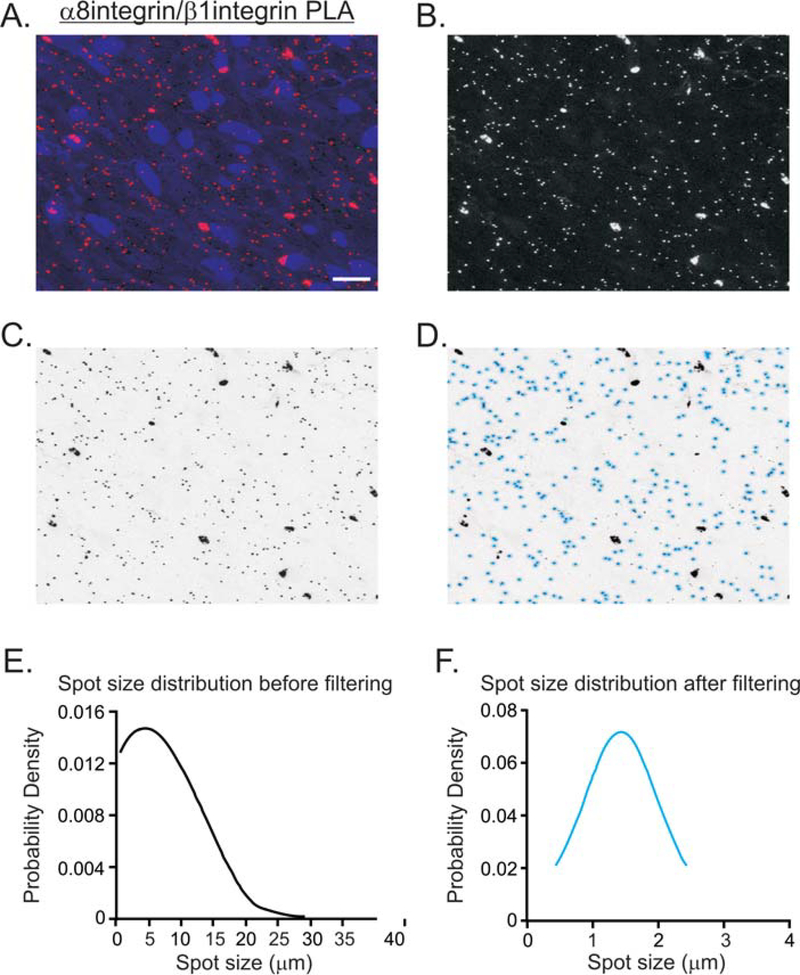
Figure 2. Thresholding and particle analysis of PLA spots from gastric fundus smooth muscle sections.
(A) Representative image of α8integrin/β1integrin PLA (red), and DAPI stained nuclei (blue). (B) The α8integrin/β1integrin PLA image with the red channel isolated and converted by Fiji. (C) Inverse of the image in B. (D) The image in C, processed for thresholding using Fiji default parameters. Real PLA spots are distinguished from the noise and circled with light blue. The PLA spot size distribution before filtering (E) and after filtering (F) by particle analysis. 228 and 162 spots were counted before and after filtering.

