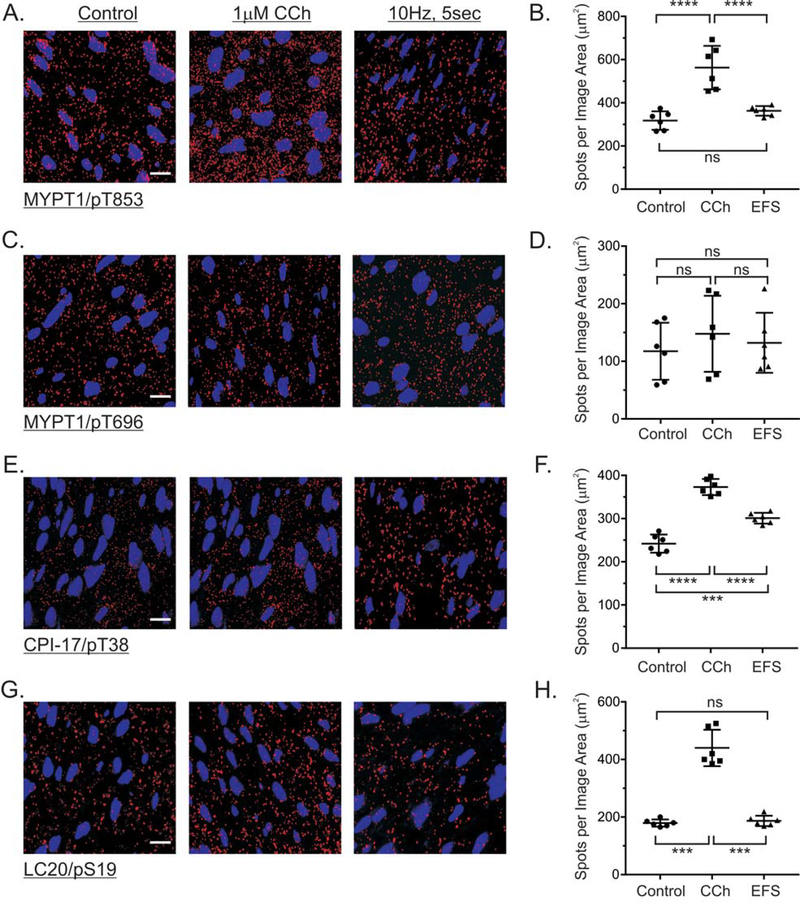
Figure 4. MYPT1, CPI-17, and LC20 phosphorylation in response to cholinergic stimulation of gastric fundus muscle strips.
Representative isPLA images and average ratios ± SD of MYPT1/pT853 (A, B), MYPT1/pT696 (C, D), CPI-17/pT38 (E, F), and LC20/pS19 (G, H) from muscles with no treatment (Control), 1μM CCh, 1min, in the presence of 0.3μM tetrodotoxin, and 10Hz, 5sec EFS in the presence of 100μM L-NNA and 1μM MRS2500. ***P<0.001, ****P<0.0001, ns P>0.05, n=3 for each treatment.

