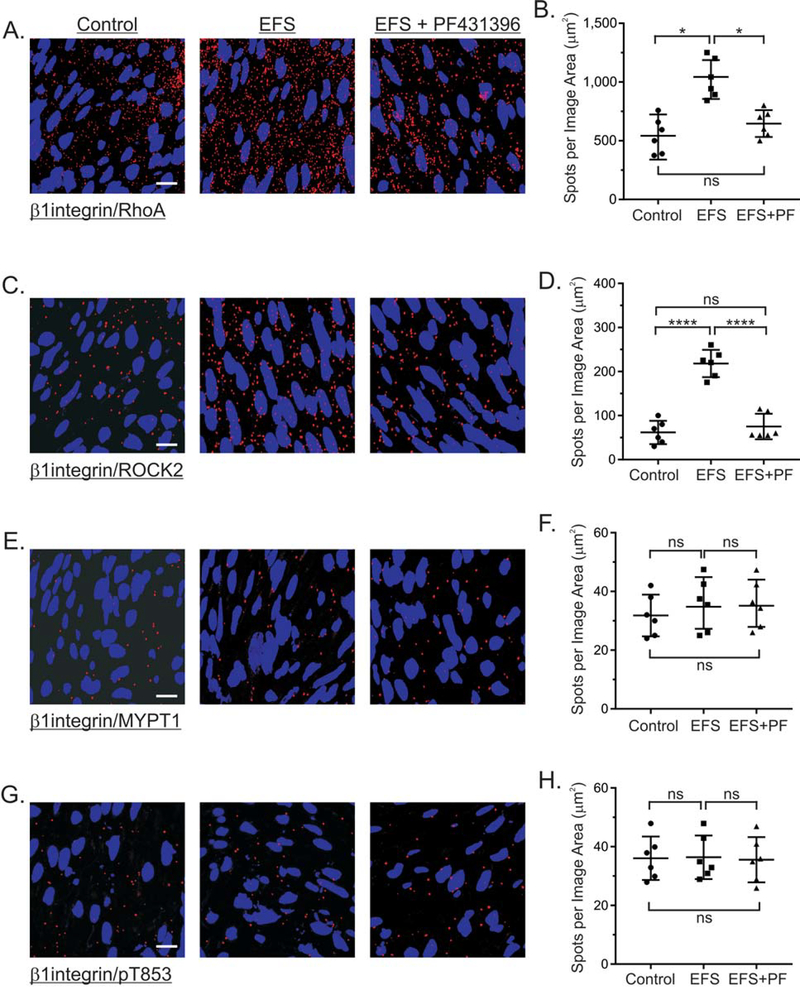
Figure 7. Effects of EFS-evoked cholinergic neurotransmisssion and PF-431396 on the association of RhoA, ROCK2, and MYPT1 with β1integrin.
Representative isPLA images and average ratios ± SD of β1integrin/RhoA (A, B), β1integrin/ROCK2 (C, D), and β1integrin/MYPT1 (E, F) and β1integrin/pT853 (G, H) from muscles with no treatment (Control), and (EFS) (10Hz, 5sec) in the presence of 100μM L-NNA and 1μM MRS2500, without, or with 1μM PF-431396. *P<0.05, ****P<0.0001, ns P>0.05, n=3 for each treatment.

