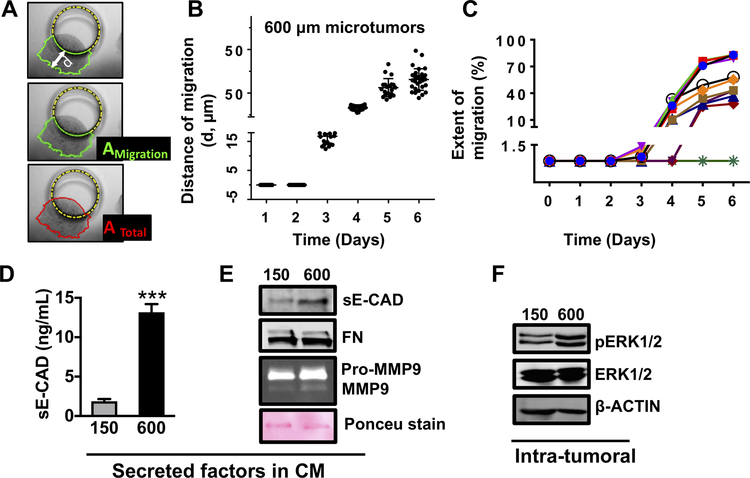
Figure 1: Large microtumors exhibit hypoxia, collective migration and aggressive phenotype.
(A) Schematic defining distance of migration (d), area of microtumor migrated out of the microwell (AMigration) and total area of the microtumor (ATotal); (B) Distance of migration for individual microtumors; each dot represents data for individual microtumor. (C) Migration trajectories of individual 600μm microtumors from day 1 to day 6 showing inter-tumoral variation in migration kinetics; Extent of migration for each time point was calculated as migrated distance/the total area of microtumor X 100. Levels of sE-CAD (D, ELISA) and sE-CAD, FN, Pro-MMP9 and MMP9 (E, western blot) in CM; (F) pERK expression in microtumor cell lysates. Data presented is representative from three independent experiments (n=3). ***p<0.001, p****< 0.0001; Unpaired t-test.

