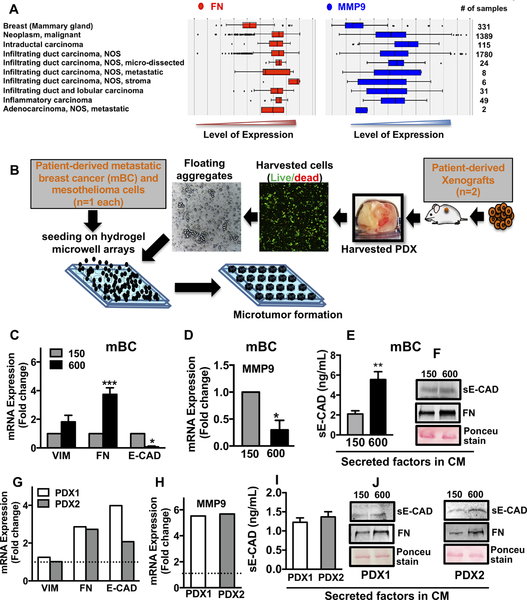
Figure 3. Tumor secretome in patient tumors, microtumors of primary tumors and PDX cells showed upregulation of FN, MMP9 and sE-CAD.
(A) Analysis of clinical data set showed higher levels of FN and MMP9 in breast carcinomas compared to normal mammary gland. (B) Hydrogel microwell arrays (150 and 600μm) were used to generate the microtumors from patient-derived primary metastatic breast cancer (mBC) cells (1 patient), mesothelioma cells (1 patient) and non-small cell lung cancer PDX model (2 PDX tumors). Analysis of mRNA expression of (C) VIM, FN, E-CAD and (D) MMP9; protein levels of sE-CAD (E,F) and FN (F) in the mBC cell-derived microtumors and similarly, in the PDX cell-derived microtumors (G-J). Dotted line in G, H refers to expression in small microtumors; non-detectable sE-CAD levels in small microtumors (I). *p<0.05, **p<0.01, ***p<0.001, Unpaired t-test.

