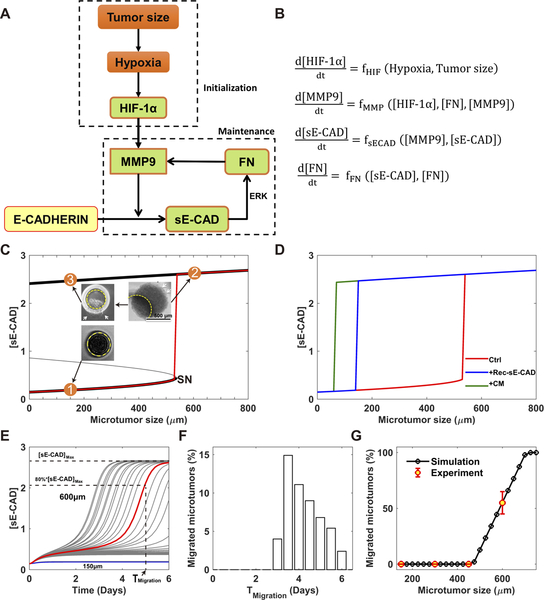
Figure 4. Mathematical model predicts an irreversible bistable switch as the mechanism of the migratory behavior of the microtumor.
(A) Schematic depiction of the core regulatory network. (B) The corresponding mathematical model described with ordinary differential equations (ODE) (details in the Supplemental Information); (C) Bifurcation analysis of the mathematical model gives an irreversible bistable switch. There is a threshold (SN) of microtumor size for the activation of this switch. Case 1: 150μm microtumor does not exceed the threshold and does not migrate. Case 2: Hypoxic microenvironment in 600μm microtumor exceeds the threshold and induces high levels of [sE-CAD] and a migratory phenotype. Case 3: Re-growing 600μm microtumors into non-hypoxic small microtumors still maintains high [sE-CAD] and migratory phenotype suggesting irreversibility of the switch; (D) The threshold of microtumor size for migration shifts to lower sizes (< 200μm) in the presence of Rec-sE-CAD (blue) or CM from migrated microtumor (green); (E) The heterogeneous dynamics of the [sE-CAD] for 150 and 600μm microtumors due to the inter-tumoral variation (n=30 microtumors for each size). It is assumed that the microtumor migration becomes visible when [sE-CAD] exceeds 80% of its steady state value with the corresponding time, Tmigration. Unlike 600μm microtumors, 150μm microtumors have negligible variation; (F) The distribution of Tmigration (n=1000 microtumors); (G) Simulation and experimental data reveal that the percentage of the migrated microtumors depends on the microtumor size.

