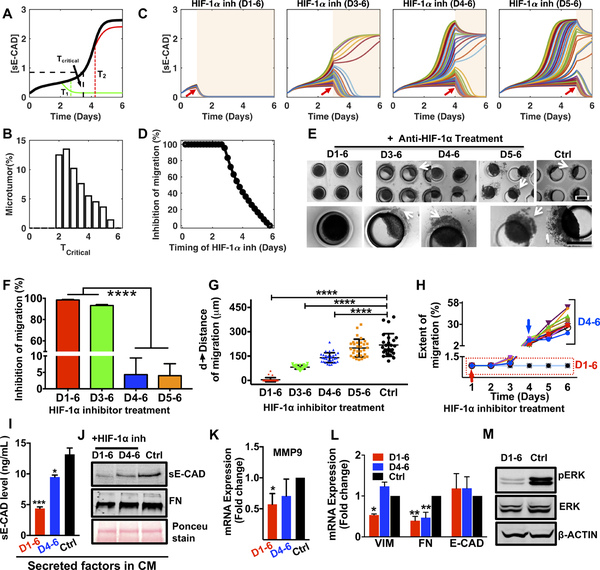
Figure 5: HIF-1α inhibition effectively attenuates microtumor migration only when HIF-1α is inhibited at early time points.
(A) Mathematical model predicts a critical time (Tcritical) to stop migration with HIF-1α inhibition for single microtumor. HIF-1α inhibition can attenuate microtumor migration (green) only if treated before the critical time (T1), but has no effect after the critical time (T2, red line); (B) Distribution of Tcritical (n=1000 microtumors) emphasizes inter-tumoral variation; (C) Dynamics of [sE-CAD] under HIF-1α inhibition at different times (n=50 microtumors for each case). Treatment periods shaded with light background. (D) HIF-1α inhibition started before day 3 inhibits microtumor migration significantly (n=1000 microtumors); (E) Photomicrographs show migratory status of 600μm microtumors on day 6 with HIF-1α inhibition at different times. The effect of HIF-1α inhibition on microtumor migration (F), distance of migration (G), and extent of migration (H). Each dot in G represents data for individual microtumor. Each line in H represents migration kinetics for individual microtumor with HIF-1α inhibition on day 1 (red arrow) or day 4 (blue arrow). HIF-1α inhibition (D1–6) downregulated (I) sE-CAD levels (ELISA), (J) sE-CAD and FN expression (western blot) in 600/CM, downregulated mRNA expression of (K) MMP9; (L) VIM and FN; and protein expression of (M) pERK. Data is presented as mean ± SEM. *p<0.05, **p<0.01, ****p< 0.0001 w.r.t. untreated 600μm microtumors; One-way ANOVA followed by Tukey’s test.

