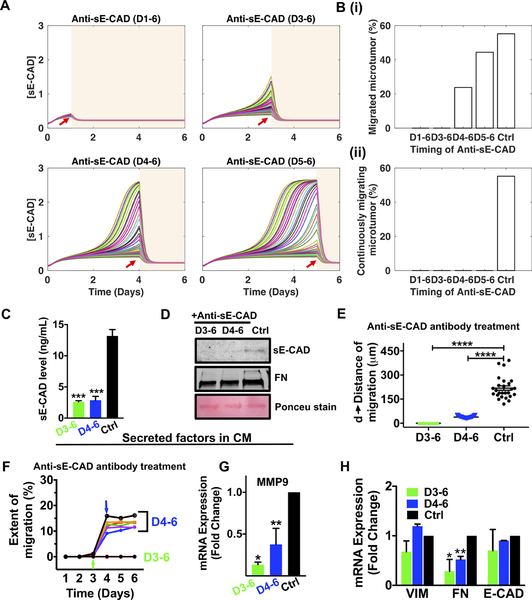
Figure 6. Inhibition of sE-CAD by anti-E-CAD antibody attenuated collective migration in 600μm microtumors.
(A) The dynamics of [sE-CAD] in 50 microtumors post anti-sE-CAD antibody treatment started on day 1, day 3, day 4 and day 5 (red arrows); (B) The fraction of migrated microtumors (upper panel, i) and continuously migrating microtumors (lower panel, ii) with anti-sE-CAD antibody treatment (n=1000 microtumors). Anti-sE-CAD antibody treatment (40μg/mL) on day 3 and 4 reduced (C) sE-CAD levels (ELISA), (D) sE-CAD and FN expression (western blot) in 600/CM, reduced (E) distance of migration, (F) extent of migration, and downregulated mRNA expression of MMP9 (G) and FN (H). Data are drawn from three independent experiments and are presented as means ± SEM. p*<0.05, **p<0.01, ***p<0.001 w.r.t. untreated control; One-way ANOVA followed by Tukey’s test.

