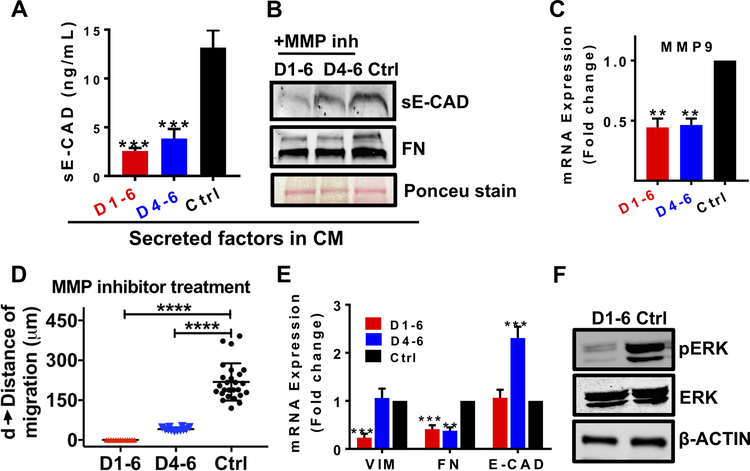
Figure 7. MMP inhibitor treatment attenuated collective migration in a time-independent manner.
MMP inhibitor treatment (20μM of GM6001) on day 1–6 and day 4–6 decreased (A) sE-CAD levels (ELISA), (B) sE-CAD and FN expression (western blot) in 600/CM, (C) downregulated MMP9 mRNA expression, (D) inhibited migration significantly, (E) downregulated VIM and FN mRNA expression, and (F) pERK microtumors compared to untreated controls. Data is presented as means ± SEM from 3 independent experiments. **p<0.01, ***p<0.001, ****p<0.0001; w.r.t. untreated control; One-way ANOVA followed by Tukey’s test.

