Figure 4.
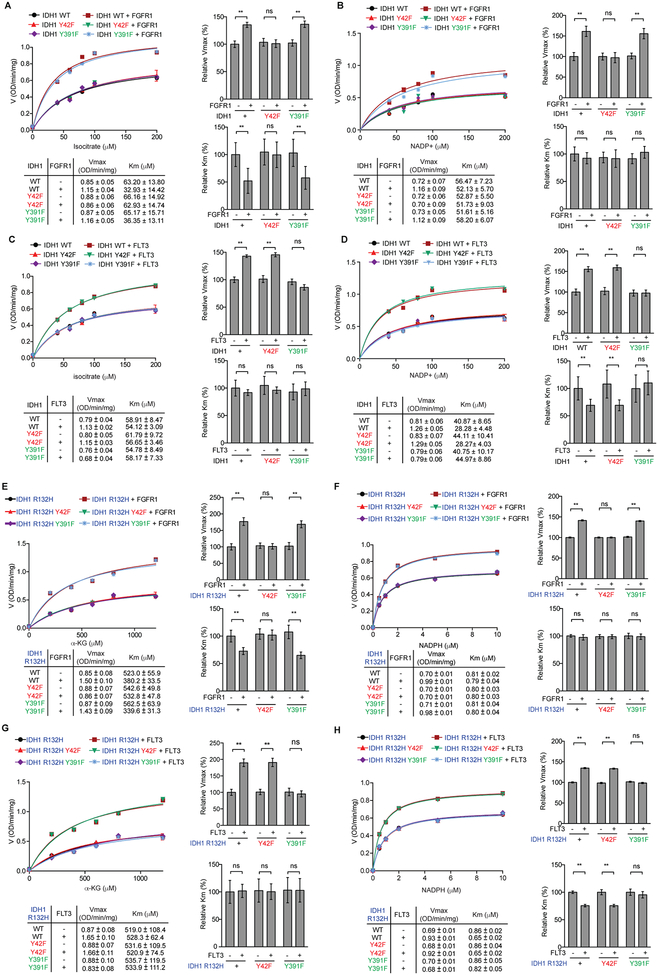
Y42 phosphorylation promotes substrate binding while Y391 phosphorylation promotes cofactor binding to enhance IDH1 WT and IDH1 R132H activation. A-D, Vmax and Km of IDH1 WT were measured using purified FLAG-IDH1 and variants incubated with recombinant active form of Group I tyrosine kinase rFGFR1 (A and B) or Group II tyrosine kinase rFLT3 (C and D) in the presence of increasing concentrations of isocitrate (A and C) or NADP+ (B and D), respectively, followed by IDH1 WT enzyme activity assay. Vmax and Km values of each treated group were calculated (lower left) and plotted (upper left). Right 2 panels represent the relative value of Vmax and Km in each treatment. E-H, Vmax and Km of IDH1 R132H were measured using purified FLAG-IDH1 R132H and variants incubated with recombinant active form of Group I tyrosine kinase rFGFR1 (E and F) or Group II tyrosine kinase rFLT3 (G and H) in the presence of increasing concentrations of αKG (E and G) or NADPH (F and H), respectively, followed by IDH1 R132H enzyme activity assay. Vmax and Km values of each treated group were calculated (lower left) and plotted (upper left). Right 2 panels represent the relative value of Vmax and Km in each treatment.
The error bars represent mean values ±SD from three replicates of each sample (**: 0.01<p<0.001; ns: not significant); Data are mean ± SD; p values were obtained by a two-tailed Student’s test.

