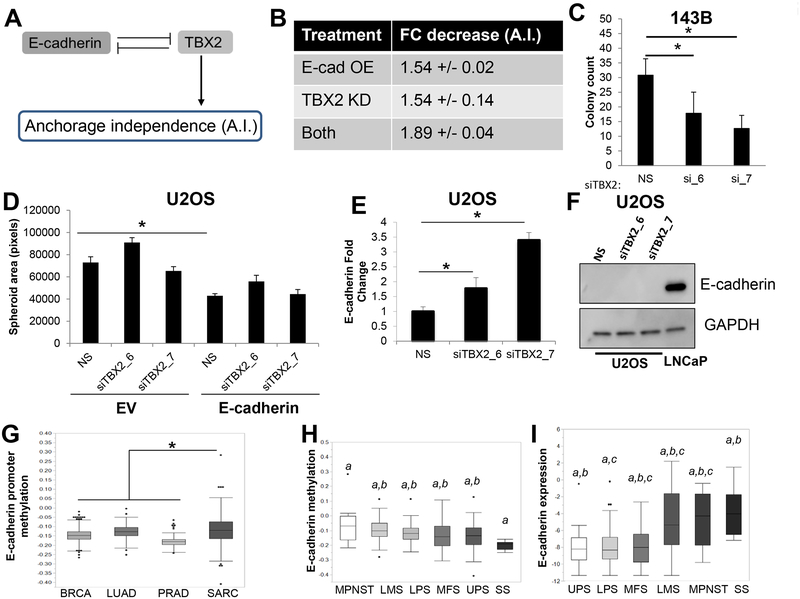
Figure 6. E-cad/TBX2 interplay mediates anchorage-independent growth.
A. Intracellular regulatory circuit modulating anchorage-independent (A.I.) growth. B. Mathematical model predicts similar effects of Ecad-OE and TBX2-KD on anchorage-independent growth. C. TBX2 knockdown using two independent siRNAs inhibited anchorage-independent growth of 143B cells. D. TBX2 downregulation did not affect sphere formation in the presence of ectopic E-cadherin expression. E. TBX2 knockdown upregulates E-cadherin mRNA. F. Western blot analysis of U2OS cells upon TBX2 knockdown indicates E-cadherin protein is not upregulated by loss of TBX2. Prostate cancer (PC) cell line, LNCaP, was used as a positive control for E-cadherin expression. G. The E-cadherin promoter is differentially methylated in sarcomas as compared to carcinomas. H. Synovial sarcomas, which often display epithelioid histopathological features, have the lowest levels of E-cadherin promoter methylation of all sarcoma subtypes. I. Among soft tissue sarcoma histological subtypes, E-cadherin mRNA expression is the highest in synovial sarcomas. Letters indicate statistically significant associations between groups. Undifferentiated pleomorphic sarcoma (UPS), liposarcoma (LPS), leiomyosarcoma (LMS), synovial sarcoma (SS), malignant peripheral nerve sheath tumors (MPNSTs), and Myxofibrosarcoma (MFS).

