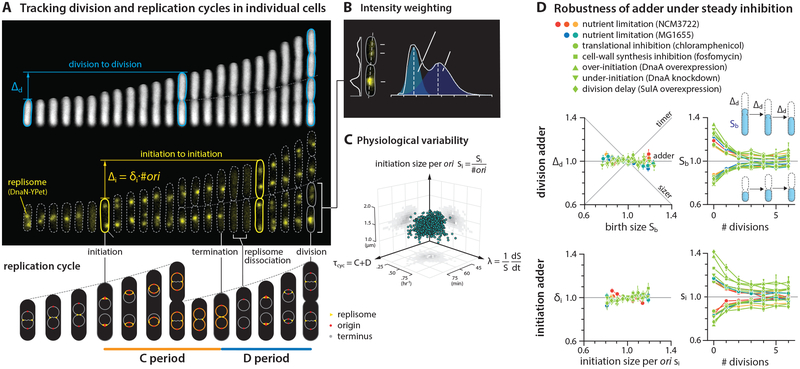
Figure 1: E. coli is both the initiation adder and division adder, robust to static inhibition of biosynthesis.
(A) Division adder vs. initiation adder. Upper: Δd is the added size between birth size Sb and division size Sd, and Δi is the total added size between two consecutive initiations. si is the cell size at initiation per origin, and δi is Δi per origin. Cell length is used as a proxy for cell size because cell width remains mostly constant during cell elongation [3] (Figure S4). Lower: Illustration of the replication cycle with two overlapping cell cycles.
(B) Resolving overlapping foci using intensity weighting (STAR Methods).
(C) Three major measured physiological parameters show 8%−20% of variation. Each dot represents measurement from a single cell.
(D) Under steady-state growth, E. coli is a division and an initiation adder, with or without static biosynthetic inhibition. Symbols are the binned data and error bars indicate standard errors of mean. In the correlation plots, the variables were rescaled by their means. 6 μM chloramphenicol and 0.05 μg/ml fosfomycin were used. See sample size in Table S3.
See also Figures S1 and S2, and Data S1.

