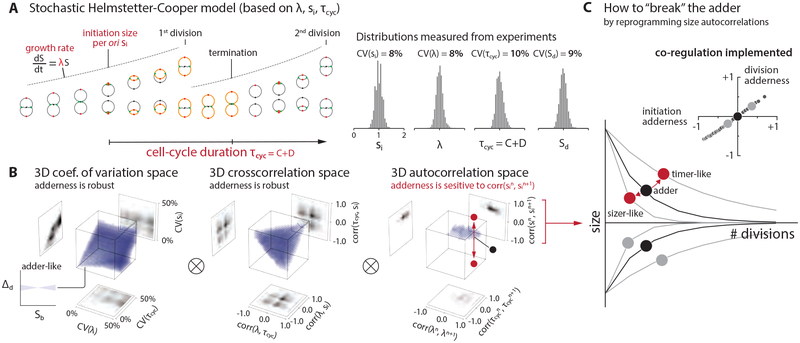
Figure 2: Survey of the 9-dimensional cell-size homeostasis space via stochastic Helmstetter-Cooper model assuming a co-regulation hypothesis between replication initiation and cell division.
(A) The schematics of single-cell simulation of cell growth and cell cycle progression. We used experimental data to introduce stochasticity to λ, τcyc, and si. (STAR Methods; Methods S1–I). We did not consider stochasticity in the septum position because its variability is the smallest (< 5%) among all measured parameters in E. coli [3].
(B) Survey results. Pearson coefficient was used to quantify both cross-correlations [e.g. corr(λ, τcyc)] and mother-daughter autocorrelations [e.g. corr(λn, λn+1)]. Each 3-D plot is based on 1,000 simulations, and each simulation computed 10,000 division cycles (Methods S1–I). Purple color indicates an adder-like behavior defined as −0.1 < corr(Δd, Sb) < 0.1 (inset on bottom left). ⊗ means the actual simulation took the convolution of all nine dimensions.
(C) Simulations revealed that the adder phenotype would break if the initiation size autocorrelation can be modulated, and the division adder and the initiation adder should co-vary (inset). The division adderness is corr(Δd, Sb), and the initiation adderness is corr(δi, si).
See also Figure S2, Data S1 and Methods S1.

