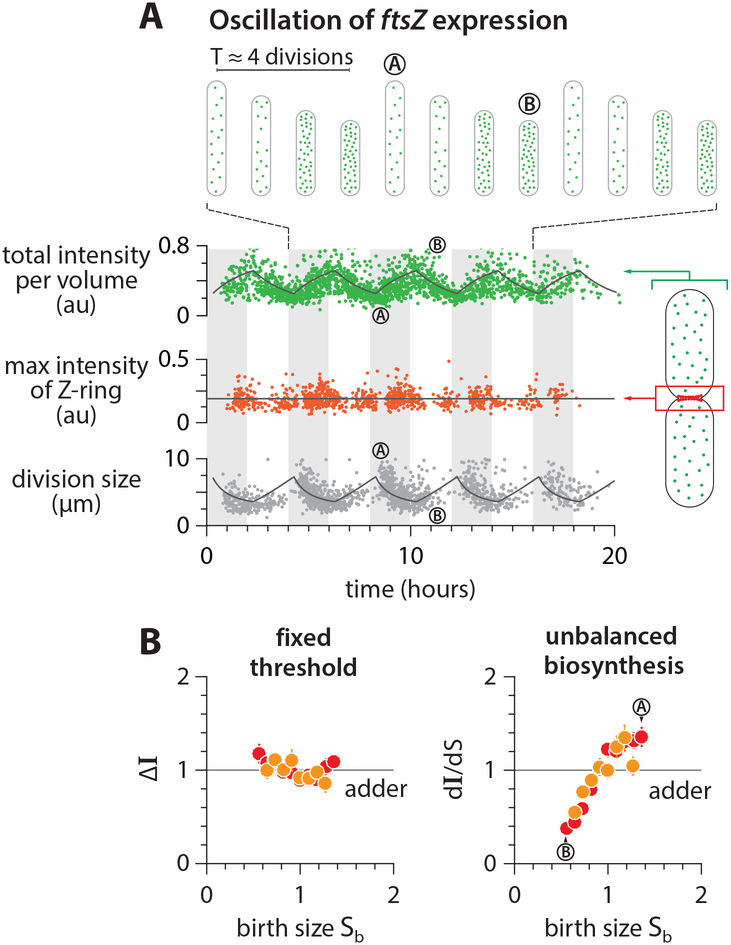
Figure 6: Testing the mechanism of adder in the FtsZ oscillation experiments.
(A) Total FtsZ-mVenus concentration oscillates in response to the periodic induction, but the threshold amount at the septum is invariant. The amount of FtsZ accumulated in the septum ring was estimated by integrating the fluorescence intensity within a fixed area enclosing the mid-cell region (STAR Methods). The solid lines represent the prediction based on balanced biosynthesis and threshold model (Methods S1–III).
(B) The total added fluorescence ΔI and the max Z-ring intensity remain invariant with respect to birth size. By contrast, the production rate of FtsZ was variable due to oscillations.
Symbol colors indicate repeats of experiments, similar to Figure 5B. See also Figure S6.

