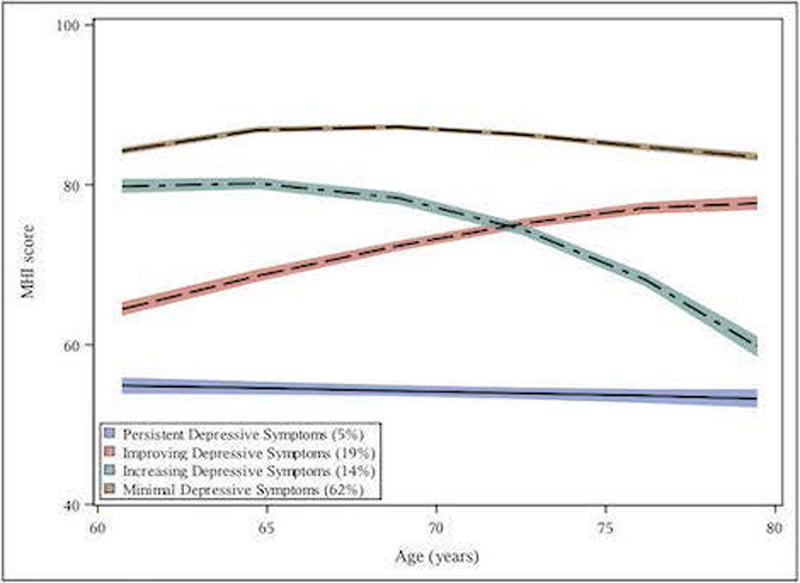
Figure 2b:
Twenty-year Multivariable-adjusted*** MHI* depressive symptom trajectories** (lower scores indicate more depressive symptoms) (N=8,801 in analytic sample)
* Mental Health inventory 5
** The figures illustrate group-based trajectories and their 95% confidence bands (shaded). Trajectories are modeled as a function of age. Group membership for identified trajectories was assigned using the group to which each participant had the highest posterior probability of membership.
***Adjusted for case/control status, pack years of smoking, BMI, antidepressant use, alcohol consumption, physical activity (MET hours/week), menopausal & hormone replacement therapy status, Charlson Index score, and paternal age at birth

