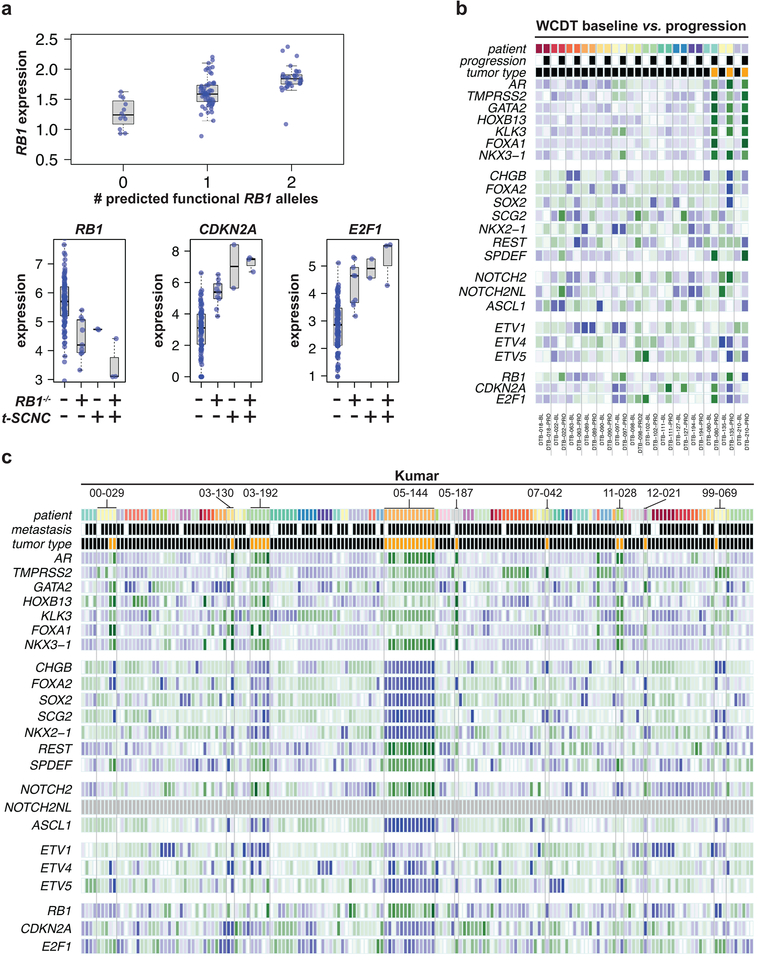
Figure 2: RB pathway expression is associated with t-SCNC status.
A) Top: expression of RB1 is significantly associated with the number of predicted functional alleles. Bottom: expression of RB1, CDKN2A, and E2F1 were significantly different in RB1−/− and t-SCNC tumors compared to RB1+/+ tumors with adenocarcinoma expression phenotype.
B) Heatmap showing expression of NEPC genes in paired WCDT baseline and progression mCRPC samples. Tumors from the same patient are indicated by a common color on the top line and set off by vertical lines. Baseline / progression status is indicated by white / black bar in second row. Adenocarcinoma / t-SCNC status assessed by gene expression profile is indicated by black / orange bar in third row.
C) Heatmap showing expression of NEPC genes in primary, localized, and mCRPC samples from Kumar data set6. All tumors from the same patient are indicated by a common color on the top line. Samples derived from primary / metastatic lesions are indicated by white / black on the second line. Adenocarcinoma / t-SCNC status assessed by gene expression profile is indicated by black / orange bar in third row.

