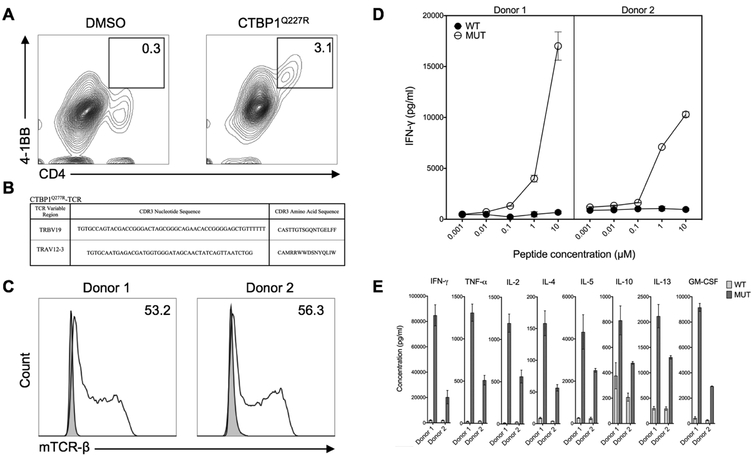
Figure 2. A TCR isolated from CTBP1Q277R-reactive TILs recognized CTBP1Q277R.
(A) F3 TILs were co-cultured overnight with EBV-B cells pulsed with CTBP1Q277R 25-mer peptide, followed by FACS sorting based on 4–1BB upregulation. Contour plots indicate the percentage of CD4+ 4–1BB+ lymphocytes in the respective co-cultures; graphs were gated on all live lymphocytes. (B) CTBP1Q277R-TCR CDR3 sequence, as identified by single-cell RNA sequencing. (C) Transduction efficiencies for CTBP1Q277R-TCR, as assessed by flow cytometry for mouse TCR-β constant chain (mTCR-β) expression. Histograms depict mTCRβ staining on untransduced (shaded) and transduced (unshaded) cells from two donors; numbers (%) indicate the estimated transduction efficiency. Graphs were gated on all live lymphocytes. (D) CTBP1Q277R-TCR-transduced T cells from (C) were co-cultured with autologous EBV-B cells pulsed overnight with serial dilutions of either wild type (WT) or CTBP1Q277R peptide (MUT). IFN-γ concentration was measured in co-culture supernatants by ELISA. A representative of two independently performed experiments is shown. (E) CTBP1Q277R-TCR transduced CD4+ cells from the same donors were co-cultured overnight with EBV-B cells stimulated with 10 μM WT or MUT peptide; concentrations of multiple cytokines in the co-culture supernatants were analyzed for a multiplex assay. Data represents average reads from two duplicate co-culture wells; error bars represent SD.

