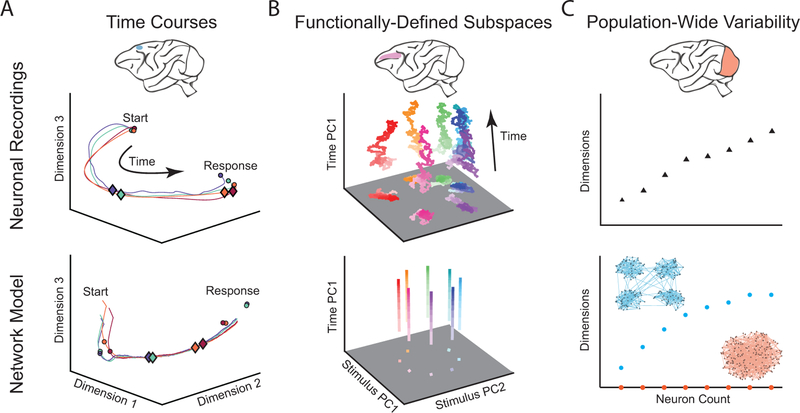
Fig 2. Examples of comparing neuronal recordings and network models using dimensionality reduction.
A. (Top) Population activity time courses from medial frontal cortex during a time production task. Each trajectory represents a time course of neuronal activity during a different produced time interval. Circles represent the start and end of the time production interval and diamonds represent a fixed time interval after the start circle. Diamonds appear closer to the start of the trajectory on long-interval trials (blue) than short-interval trials (red), indicating that neuronal activity traverses the path at different speeds during the two intervals. (Bottom) Circles represent fixed points in the model network’s dynamics and diamonds represent a fixed time interval after the start of the time production task. A similar difference in traversal speed is observed in the model network as was observed in the neural recordings. Adapted with permission from [48]. B. (Top) Delay period activity from prefrontal cortex during a delayed saccade task. Each trajectory represents a different stimulus condition. The trajectories for different stimuli remain well-separated in a stimulus subspace throughout the delay period. (Bottom) Network model activity demonstrating similar subspace stability. Adapted with permission from [20]. C. (Top) Dimensionality of population-wide neuronal variability in primary visual cortex increases with the number of neurons recorded. (Bottom) A similar dimensionality trend is observed for a spiking network model with clustered excitatory connections (blue), but not for a model with unstructured connectivity (red). Adapted with permission from [31].

