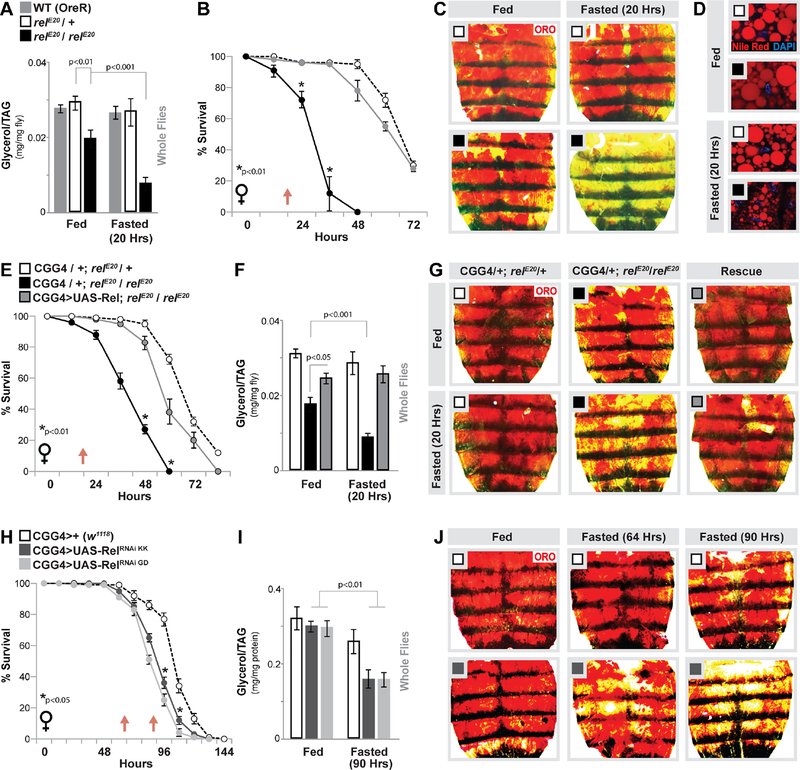
Figure 1: Relish Function in Fat body Directs Lipid Metabolism in Response to Metabolic Adaptation.
(A-D) Relish-dependent changes in lipid metabolism and survival in response to fasting (A) Total triglyceride (TAG) levels of whole flies (OreR (WT-wild type) control, relE20/+ (heterozygote control), or relE20/relE20 (mutant) genotypes) before and after fasting (20 hours). n = 4–5 samples. (B) Starvation resistance of female flies. n = 5 cohorts (total 87–95 flies). The red arrow indicates time-point of fasting assays. (C) Oil Red O (ORO) and (D) Nile red stain of dissected carcass/ fat body before and after fasting (20 hours). Nile red (neutral lipids; red) and DAPI (DNA; blue) detected by fluorescent histochemistry.
(E-G) Re-expressing Relish (UAS-Rel) in fat body (CGGal4) of Relish-deficient flies restores metabolic adaptation responses. (E) Starvation resistance of female flies (CGGal4/+; relE20/+ (control), CGGal4/+; relE20/relE20 (mutant), or CGGal4/UAS-Rel; relE20/relE20 (Rescue)). n = 5 cohorts (total 79–98 flies). The red arrow indicates time-point of fasting assays. (F) Total TAG levels of whole flies (n = 4–5 samples) and (G) ORO stain of dissected carcass/ fat body before and after fasting (20 hours).
(H-J) Changes in lipid metabolism and survival upon Relish depletion (RNAi lines v108469-KK and v49413-GD) in fat body (CGGal4). (H) Starvation resistance of female flies. n = 6 cohorts (total 139–149 flies). The red arrow indicates time-point of fasting assays. (I) Total TAG levels of whole flies (n = 4–5 samples) and (J) ORO stain of dissected carcass/ fat body (only RNAi v108469-KK shown) before and after fasting (64 and/or 90 hours).
Bars and line graph markers represent mean ± SE. All flies were 7 days old post-eclosion. See also Figures S1–S3.

