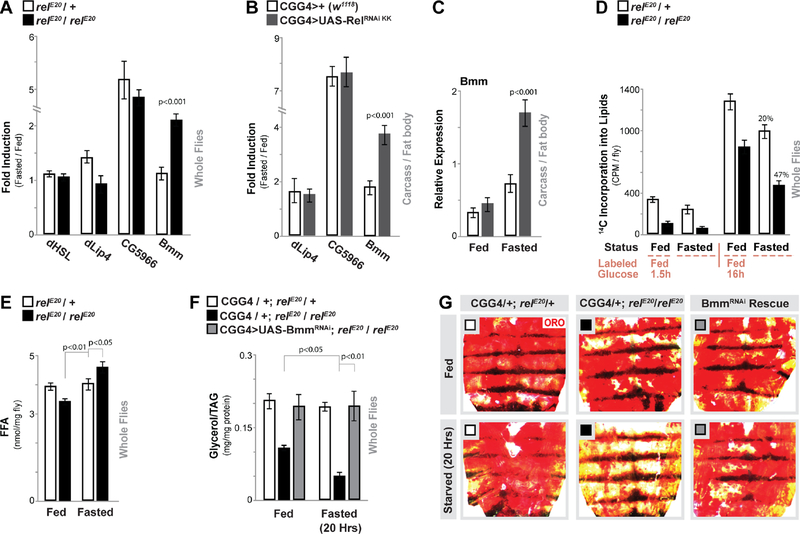
Figure 2: Relish Controls Fasting-induced Triglyceride Lipase Bmm Transcription and Lipolysis.
(A) Drosophila HSL, lip4, CG5966, and bmm transcription (measured by qRTPCR in whole flies, plotted as fold induction (20 hours fasted/fed) of relative expression). relE20/+ (heterozygote control), or relE20/relE20 (mutant) genotypes. n = 3 samples.
(B-C) Changes in lip4, CG5966, and bmm transcription (measured by qRT-PCR in dissected carcass / fat body, plotted as fold induction (64 hours fasted/fed) of relative expression) upon Relish depletion (RNAi line v108469-KK) in fat body (CGGal4). (C) Relative expression values (from (B)) for bmm transcription. n = 3–4 samples.
(D) Quantification of lipid breakdown. Incorporation of 14C-labeled glucose into total lipids (from whole flies) from labeled-glucose fed (1.5 hours or 16 hours) or fasted (20 hours) flies are shown. Percent change in loss of 14C-labeled lipids after fasting is also shown. n = 3–4 samples.
(E) Free fatty acid (FFA) levels measured in whole flies before and after fasting (20 hours). n = 4 samples.
(F-G) Attenuating Bmm (RNAi line v37877) in fat body (CGGal4) of Relish-deficient flies restores metabolic adaptation responses. (F) Total TAG levels of whole flies (n = 3–4 samples) and (G) Oil Red O stain of dissected carcass/ fat body before and after fasting (20 hours, CGGal4/+; relE20/+ (control), CGGal4/+; relE20/relE20 (mutant), or CGGal4/UAS-Bmm RNAi; relE20/relE20 (Rescue)).
Bars represent mean ± SE. All flies were 7 days old post-eclosion. See also Figure S4.

