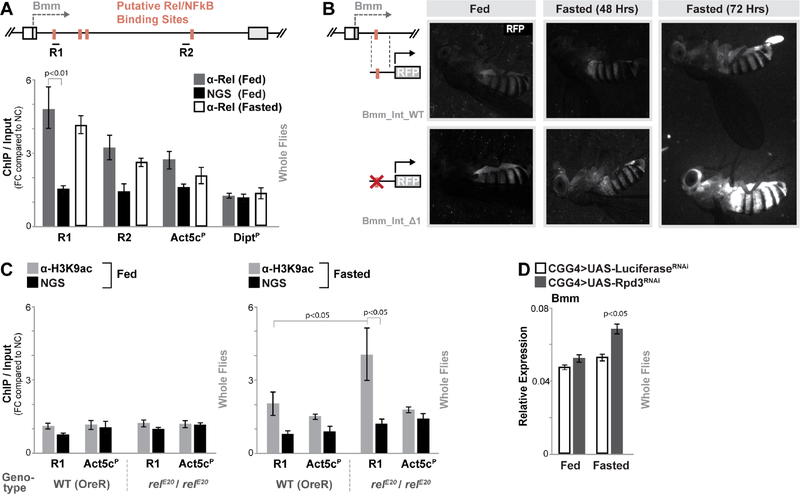
Figure 3: Relish binds to a Regulatory Region in the Bmm Locus.
(A) Schematic shows Bmm locus (focusing on first intron proximal to transcription start site) and putative NF-κB/Rel binding motifs (identified by Clover). R1 and R2 represent regional target sites (and corresponding primer sets) tested in ChIP-qPCR analysis. The histogram represents ChIP-qPCR analysis of Relish binding to the Bmm locus (compared to the Actin5c promoter (Act5cP) and the Diptericin promoter (DiptP) in fed or fasted (20 hours) conditions. ChIP-qPCR analysis with normal goat serum (NGS) is included as a control. Plotted as fold change (FC) of indicated PCR primer sets compared to a negative control (NC) primer set. n = 3 biological replicates.
(B) Requirement of Bmm locus Rel binding site in limiting induced gene expression measured by RFP fluorescence in transgenic flies carrying indicated reporters (during fed and fasted (48 or 72 hours) conditions).
(C) ChIP-PCR analysis of H3K9ac enrichment in R1/Relish-binding region of the Bmm locus in wild type (WT; OreR) and relE20/relE20 (mutant) genotypes before and after fasting (20 hours). n = 3 biological replicates.
(D) Changes bmm transcription (measured by qRT-PCR in whole flies) before and after fasting (20 hours) upon Rpd3 depletion (RNAi line TRiP 36800) in fat body (CGGal4). Controls are a genetically matched RNAi targeting luciferase. n = 4–6 samples.
Bars represent mean ± SE. All flies were 7 days old post-eclosion. See also Figure S3 and S4.

